 Buy Crypto
- Markets
 Futures
- Spot
- Copy Trade
- Earn
- More
Glassnode: BTC Rebound a "Fakeout," Bottom Fragile and Yet to Be Built
Original Title: Failed Breakout
Original Authors: CryptoVizArt, Chris Beamish, Antoine Colpaert, Glassnode
Original Translation: AididiaoJP, Foresight News
Entering early January 2026, the market showed signs of seller exhaustion, creating an opportunity for a rebound towards the upper boundary of the current trading range. However, this rebound came with higher risk as the price was approaching the ~$98,000 area where recently bought-in investors had active "break-even" selling pressure.
Key Takeaways
· On-chain structure remains fragile: Price hovering around key cost basis levels lacks continuous confirmation of long-term holder conviction.
· Overhang in the supply persists: Recently bought-in investors face overhead resistance limiting upside momentum, making any rebound prone to sell-offs.
· Spot funding trend turns positive: Seller pressure on major exchanges has eased, but buying behavior remains selective rather than broad-based.
· Treasury flows remain scattered: Treasury activity exhibits sporadic, event-driven characteristics, yet to form a coordinated buying trend, with limited impact on overall demand.
· Derivatives market participation low: Futures volume contracting, leverage usage cautious, market in a low participation state.
· Options market under short-term pressure only: Short-term implied volatility responding to risk events, while medium to long-term volatility remains stable.
· Hedge demand briefly spikes then reverts to norm: Surge in put/call volume ratio has subsided, indicating risk aversion is tactical.
· Dealer gamma positioning leans bearish: This weakens mechanical support for price stability, increasing market sensitivity to liquidity shocks.
On-chain Deep Dive
Over the past two weeks, the anticipated technical rebound has largely materialized, with the price stagnating below short-term holder cost basis after encountering resistance, once again confirming substantive selling pressure overhead. This report will focus on analyzing the structure and behavior of this "overhead" supply, revealing emerging seller dynamics.
Technical Rebound Meets Resistance
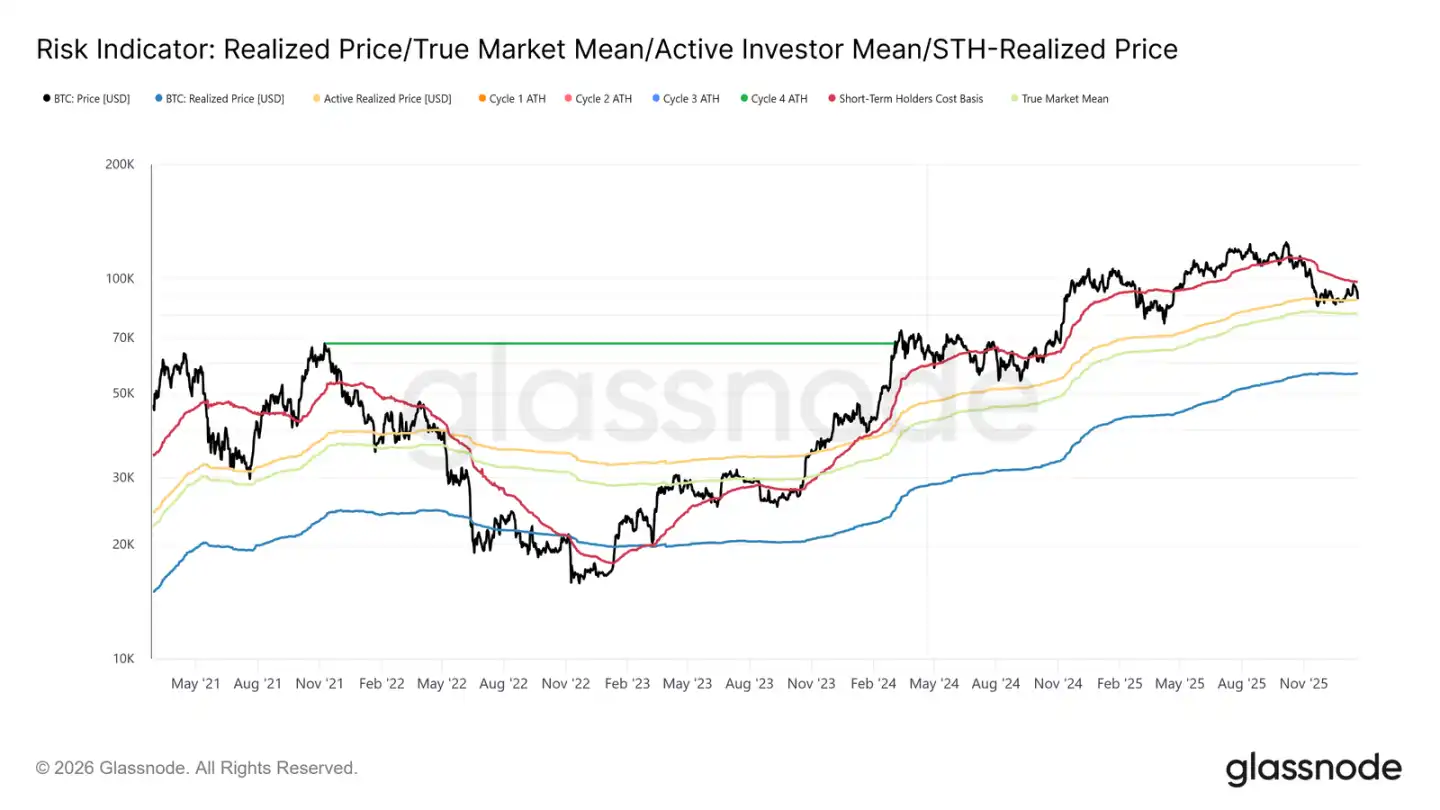
A clear narrative has emerged: the market has been in a mild bearish phase. Its downward bottom is supported by a true market value of $81,000, while the upward top is constrained by the average cost of short-term holders. This range has formed a fragile equilibrium where selling pressure is absorbed, but upward attempts have been repeatedly met with selling from investors who bought in during the first to third quarters of 2025.
Entering early January 2026, the weakening of selling pressure has opened a window for a rebound towards the upper range. However, as the price approaches the $98,000 region, the willingness to sell near the cost price of recent buyers has intensified, exacerbating the risk of this rebound.
The recent price being capped around $98,400 (short-term holder cost basis) mirrors the market structure of the first quarter of 2022. Back then, the market repeatedly failed to decisively break through the recent buyers' cost zone, leading to a prolonged consolidation phase. This similarity highlights the fragile nature of the current recovery attempt.
Supply "Overhead" Pressure Persists
Based on the observation of price being resisted at key cost levels, further examination of on-chain supply distribution can better explain why upward momentum has been repeatedly thwarted.
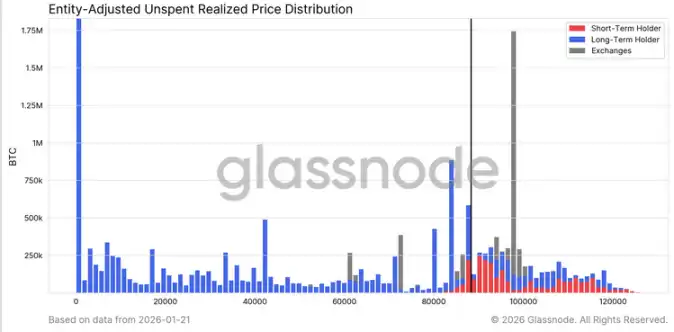
The URPD (Unrealized Profit/Loss Distribution) chart clearly reveals why the excess supply above $98,000 remains a key force suppressing mid-term rebounds. The recent rebound partly filled the "air pocket" between $93,000 and $98,000, mainly driven by early buyers transferring to new entrants, creating a new cluster of short-term holder supply.
However, the supply distribution above $100,000 shows a broad and dense supply zone, with this portion of tokens gradually transitioning to long-term holder positions. This undigested "overhead" supply is a persistent source of selling pressure, likely to keep the price suppressed below $98,400 (short-term holder cost line) and the psychological $100,000 mark. Therefore, a significant and sustained acceleration in demand momentum is needed to achieve an effective breakthrough.
Long-Term Holders Also Pose Resistance
Expanding the view from short-term holders to long-term positions, we find the same structural constraints still exist.
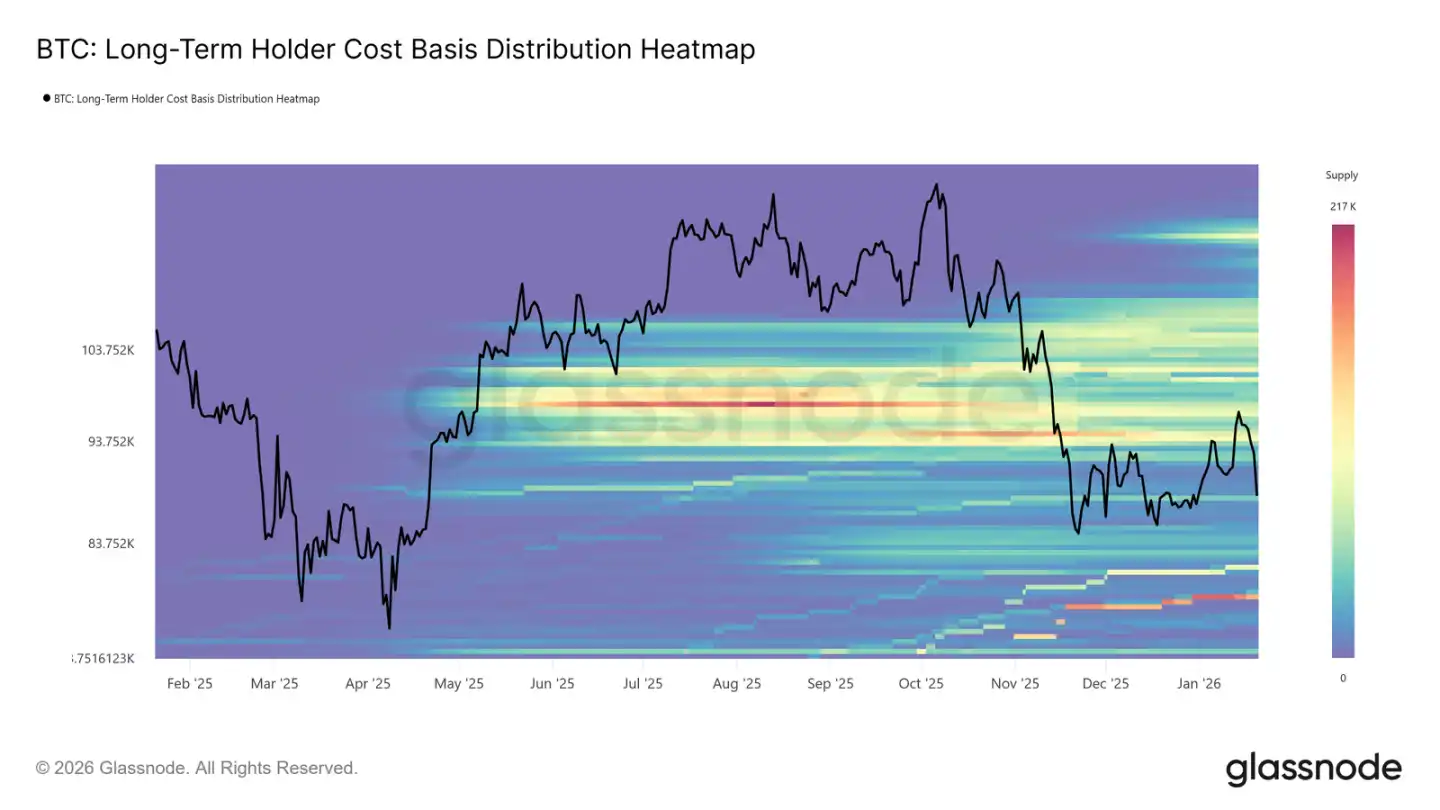
The long-term holder cost basis distribution heatmap shows a dense area of long-term coin holding costs above the current spot price. When the price rebounds to these historical buy-in levels, this area represents significant potential selling liquidity.
Before new, strong-enough demand emerges and absorbs the overhanging supply, long-term holders will always be a potential source of resistance. Therefore, unless this part of the "overhang" supply is completely absorbed, upside potential may remain limited, and any rebound is likely to face new selling pressure.
Rebound Encounters Profit-Taking and Stop-Loss Selling
Furthermore, we can identify which investor groups actively took profits (or stopped losses) during the recent rally towards around $98,000, thus suppressing the price.
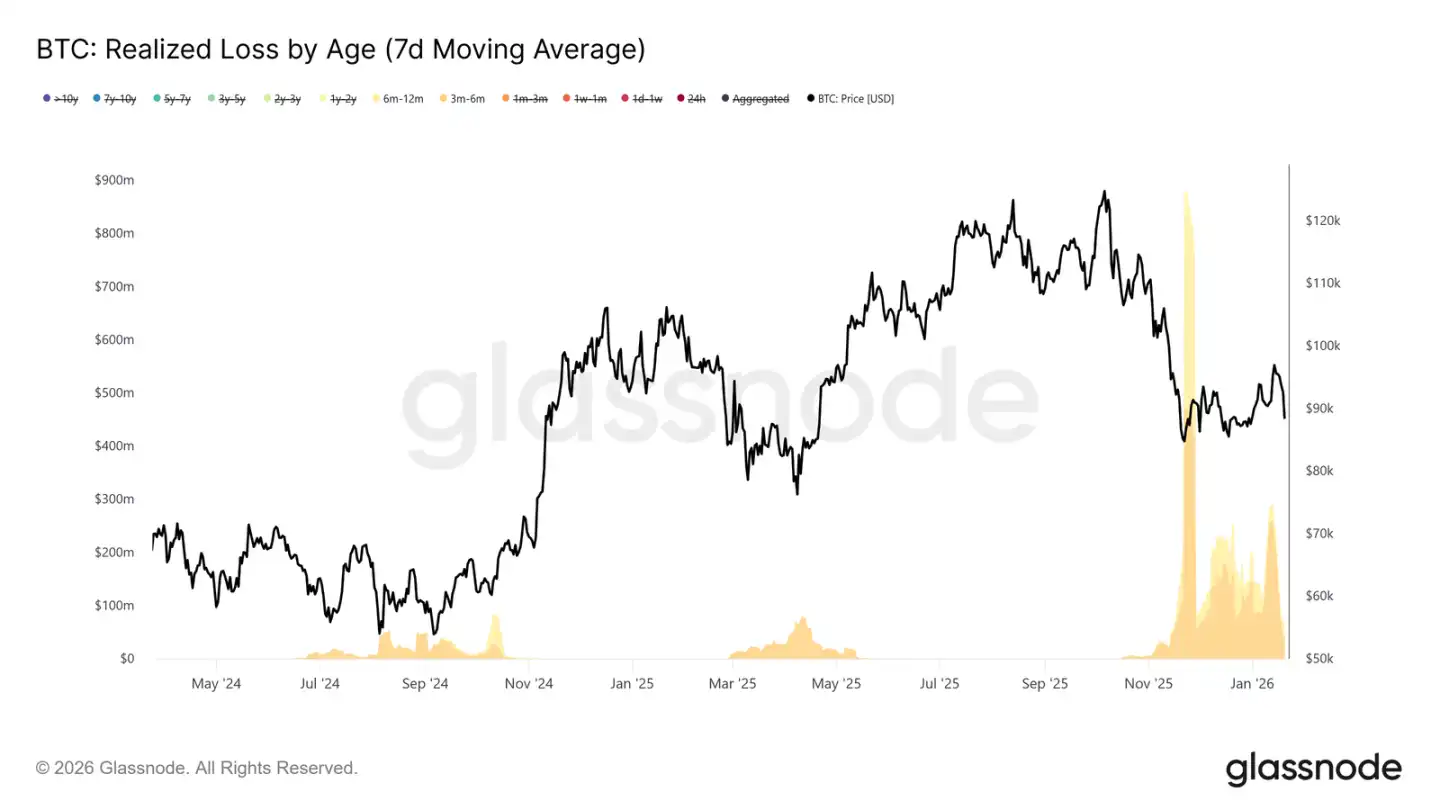
Realized loss data segmented by holding period shows that loss-selling mainly came from the 3-6 month holder group, followed by 6-12 month holders. This pattern is a typical characteristic of "painful selling," especially common among those who bought above the $110,000 price level and are now choosing to exit near their cost basis. This behavior reinforces selling pressure around key recovery levels.
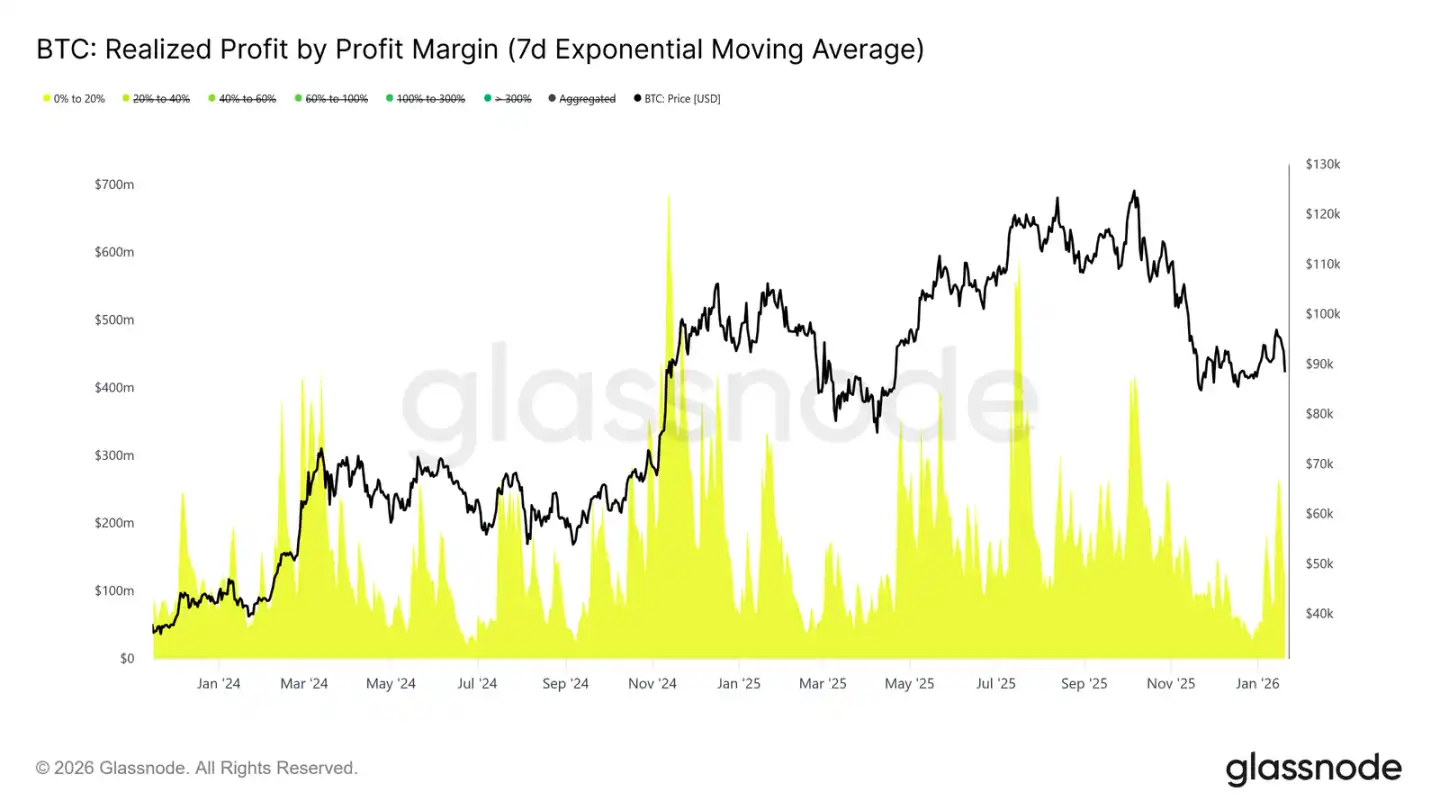
At the same time, realized profit data segmented by profit margin indicates a significant increase in profit-taking in the 0% to 20% profit margin range. This highlights the influence of "break-even sellers" and short-term swing traders, who tend to take small profits and exit rather than wait for the trend to continue.
This behavior is common during market transition periods when investor confidence is fragile, focusing more on capital preservation and tactical profit-taking. The increase in low-profit selling pressure is steadily undermining upward momentum as supply continues to be released near cost basis.
On-Chain Market Observations
Spot Funds Flow Turns Positive
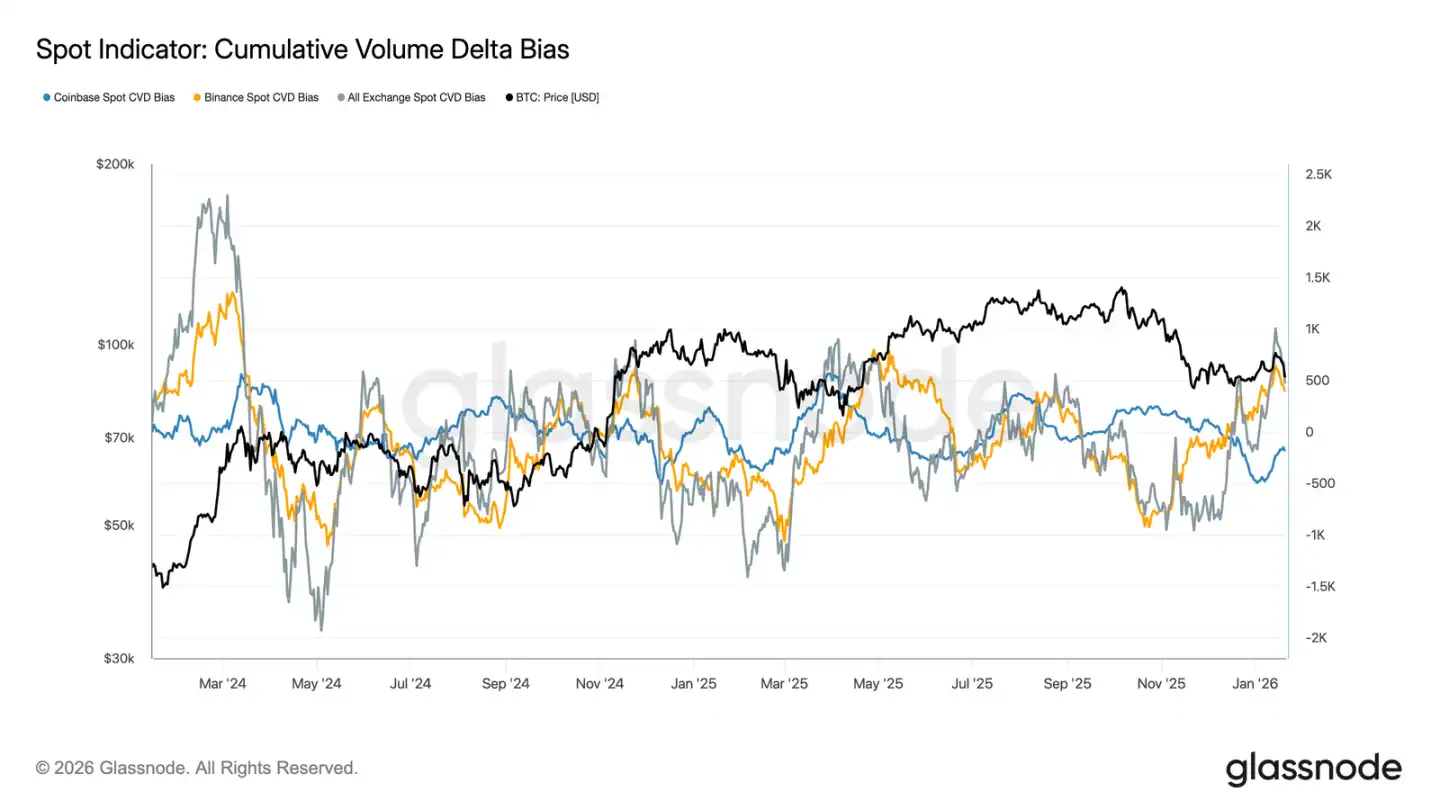
Spot market behavior has improved somewhat after the recent decline. Binance and exchange platform composite CVD (Cumulative Volume Diff) indicator has turned back to net buy status, indicating that spot participants are starting to reabsorb chips rather than sell on rallies, contrasting with the sustained selling pressure during the previous consolidation phase.
Coinbase, which has been a major source of selling pressure during the range-bound trading, has also significantly slowed its net selling speed. The reduction in selling pressure from Coinbase helps reduce overhead supply, stabilize price action, and support the recent rebound.
Although spot participants have not yet shown the continuous, aggressive buying typical of a trending expansion phase, the major platforms returning to net buying signal a positive improvement in the underlying spot market structure.
Intermittent Inflow of Funds into Digital Asset Treasury
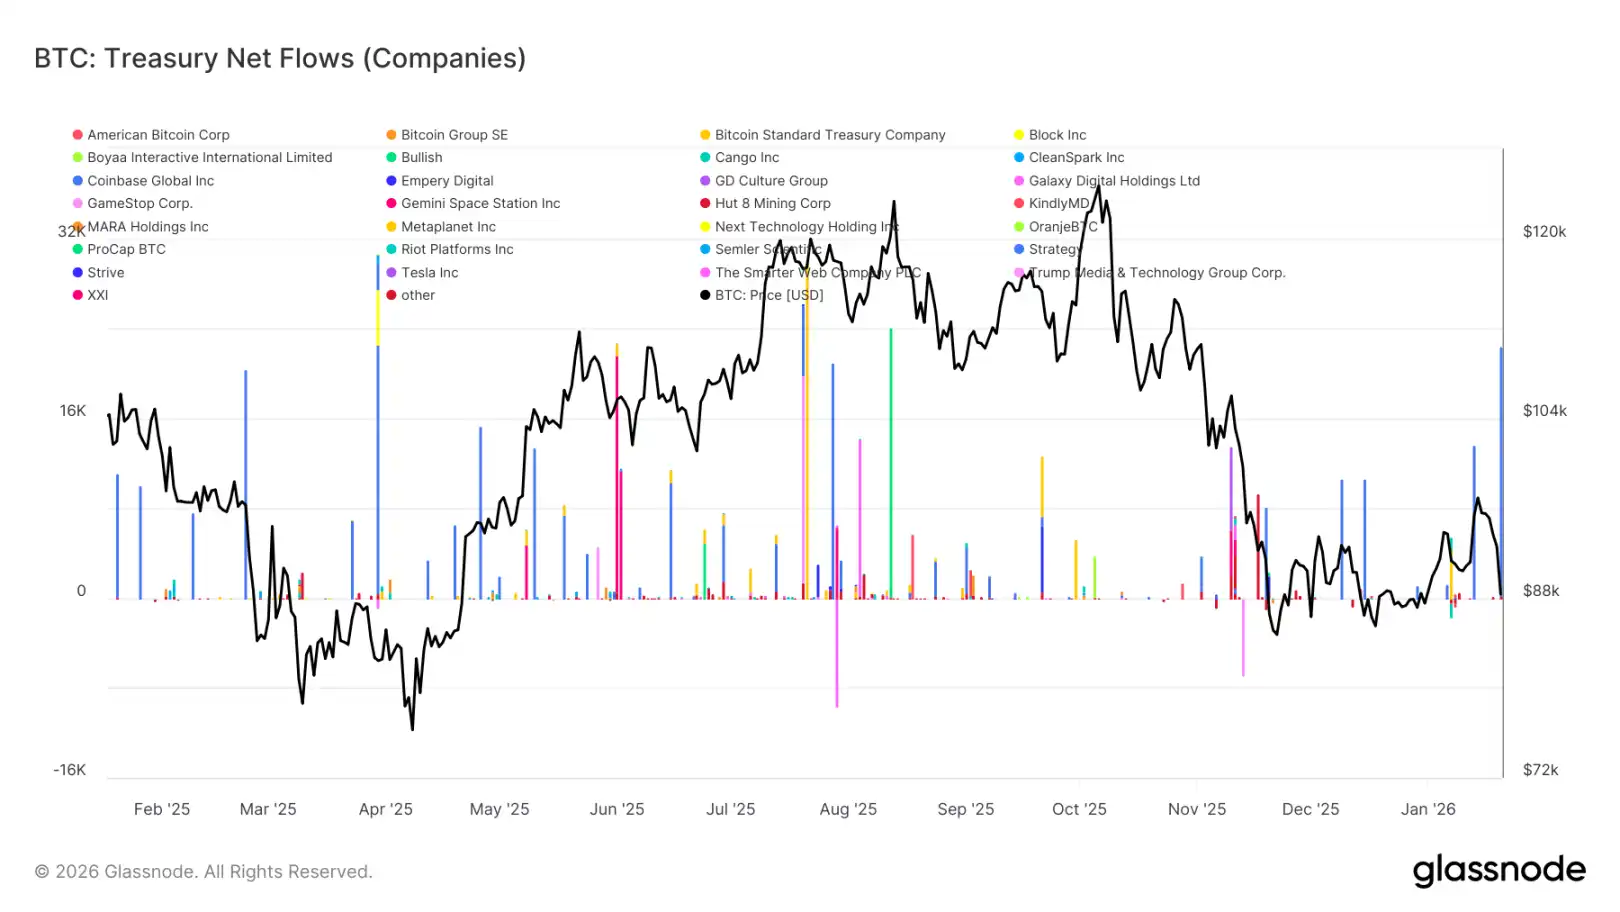
The recent net fund flow into digital asset treasuries continues to exhibit a scattered and uneven pattern, with activities mostly driven by isolated events rather than broad trend-buying. Although there have been significant individual buying spikes by some companies in the past few weeks, overall corporate demand has not transitioned into a sustained accumulation mode.
Overall, the fund flow into digital asset treasuries has been fluctuating narrowly around the zero line, indicating that the majority of corporate treasuries are currently in a state of watchful waiting or opportunistic operations rather than systematic accumulation. This is in sharp contrast to the earlier phase where multiple companies collectively bought in, driving the trend acceleration.
Generally speaking, the latest data indicates that corporate treasuries are only a marginal, selective source of demand, with their impact being intermittent and not yet exerting a decisive influence on the overall price dynamics.
Lackluster Derivatives Market
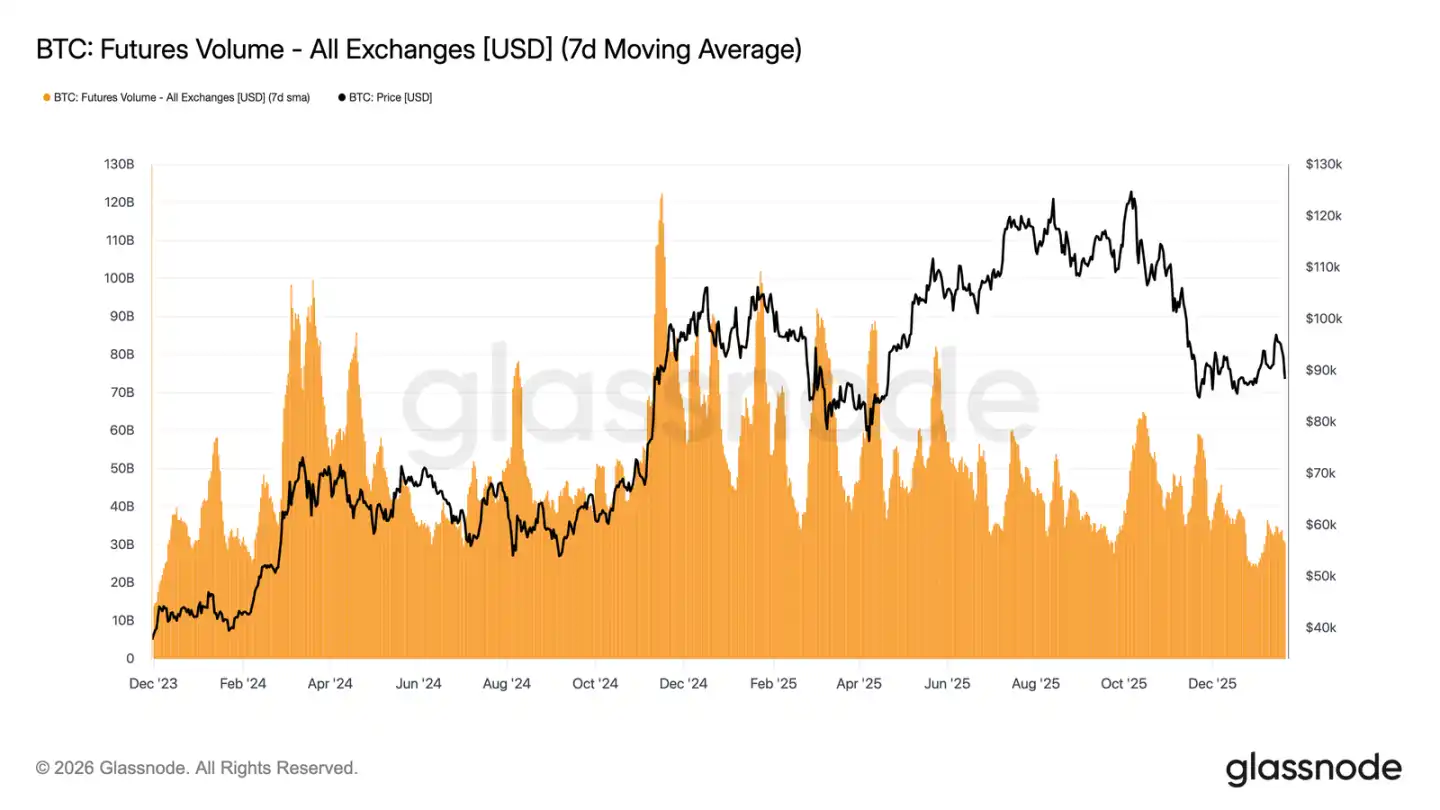
The 7-day moving average trading volume of Bitcoin futures continues to decline, far below the levels usually associated with a trending market. Recent price fluctuations have not been accompanied by effective volume amplification, highlighting the low participation and lack of confidence in the derivatives market.
The current market structure indicates that recent price actions are more driven by sparse liquidity rather than aggressive positioning. The adjustment of open interest has not been accompanied by a synchronous increase in trading volume, reflecting more of a repositioning of existing positions and risk rebalancing rather than fresh leveraged inputs.
In summary, the derivatives market is currently in a state of low participation and "quietness," with muted speculative interest. This "ghost market" characteristic means that the market could be very sensitive to any resurgence in trading volume, but currently, its impact on price discovery is limited.
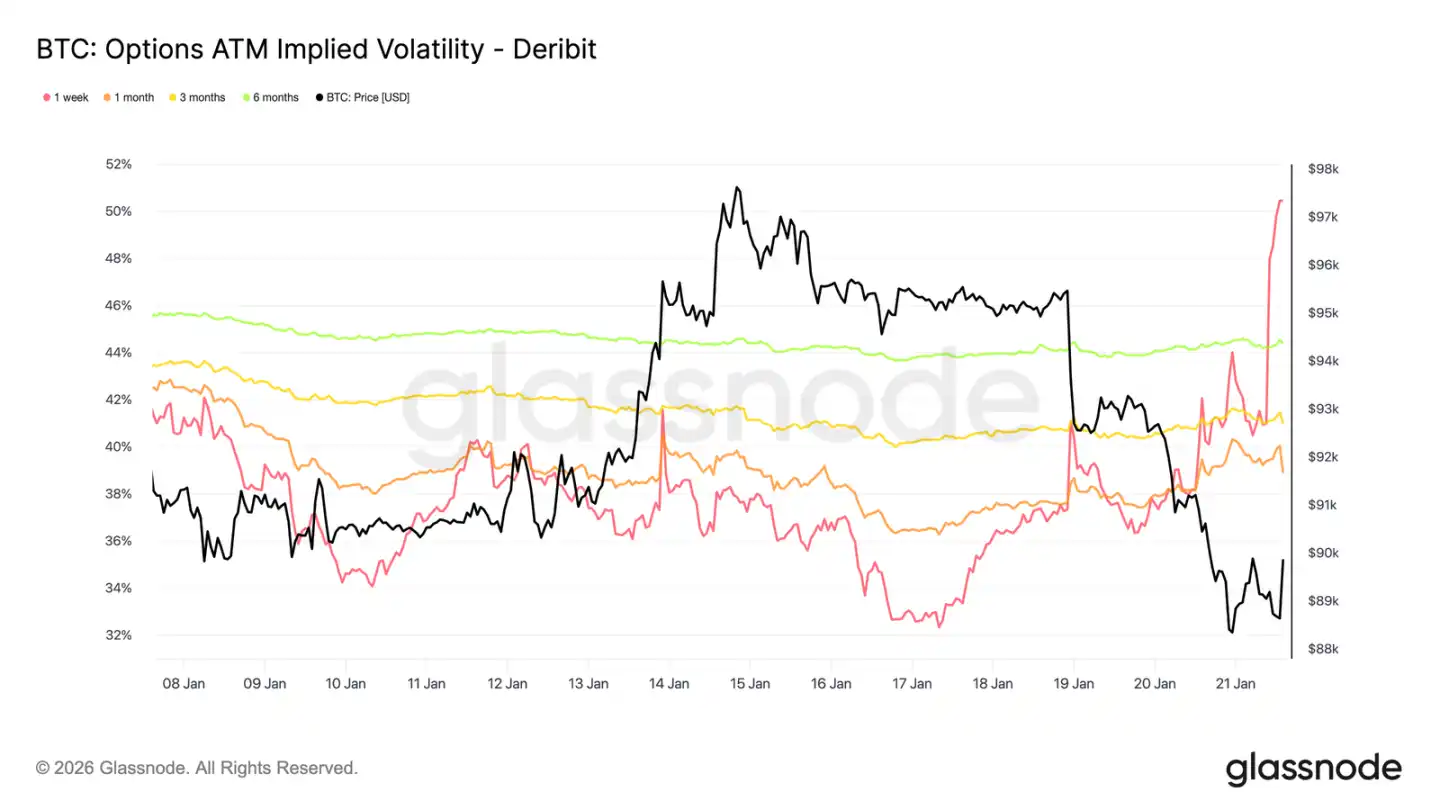
Implied Volatility Spikes Only in the Short Term
A spot sell-off triggered by macro and geopolitical news has only led to a short-term surge in volatility. Since the Sunday drop, the one-week implied volatility has risen by over 13 volatility points, while the three-month implied volatility has only increased by about 2 points, and the six-month implied volatility has remained almost unchanged.
The sharp steepening at the very front end of the volatility curve indicates that traders are engaging in tactical operations rather than reassessing the mid-term risk structure. Only the short-term volatility adjustment reflects event-driven uncertainty, rather than a transformation of the entire volatility regime.
The market is pricing in short-lived risks, not enduring turmoil.
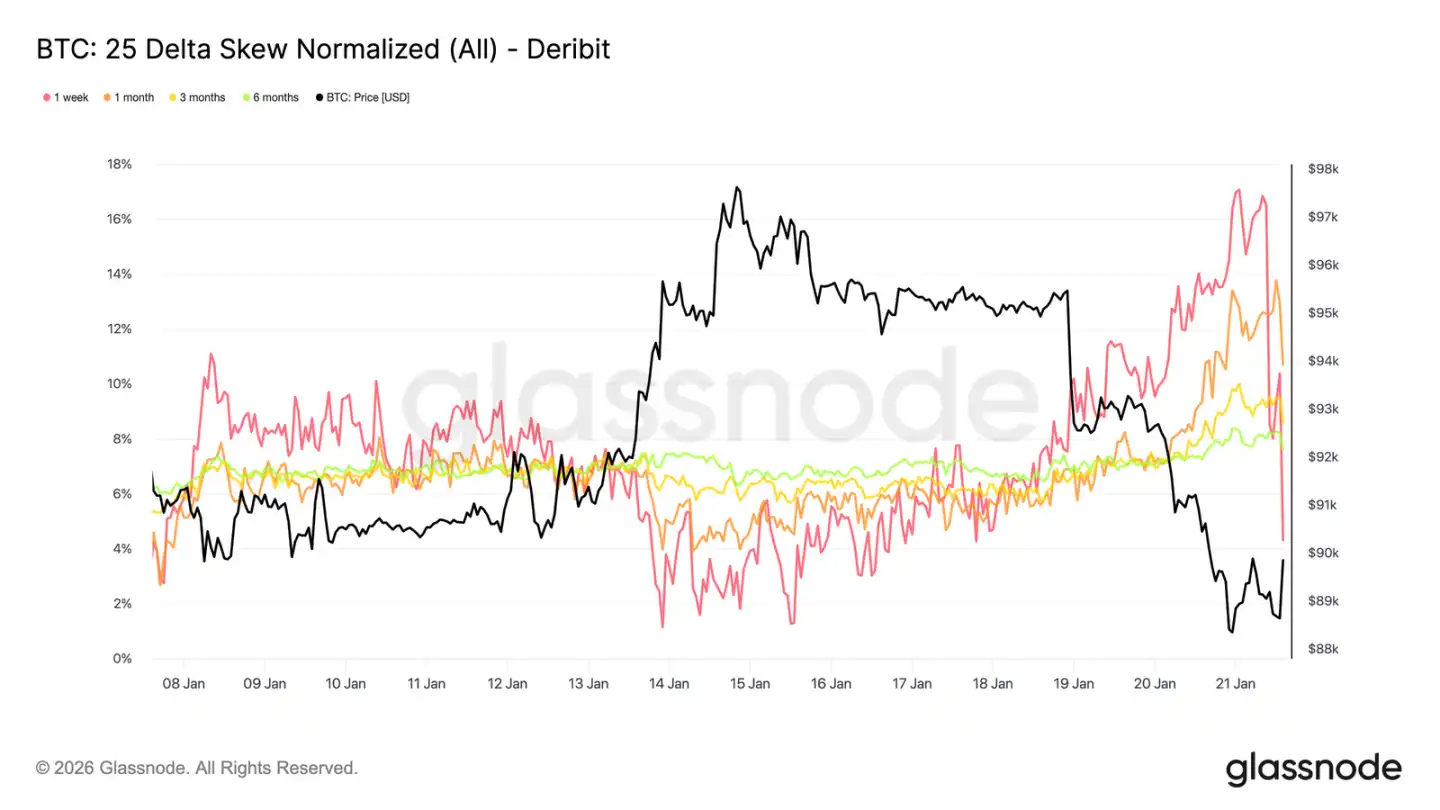
Short-Term Option Skew Spike
Similar to the at-the-money volatility, short-term skew dominated this adjustment. After nearing equilibrium about a week ago, the one-period 25 delta skew has dramatically shifted towards a "more expensive put option" state.
Since last week, this skew indicator has moved about 16 volatility points towards the put side, reaching an almost 17% put premium. The one-month skew has also reacted, while the skew for longer maturities, already in put territory, only slightly deepened this time.
Such a pronounced skew tilt typically accompanies a localized extreme market condition, where positions are crowded, making it difficult to sustain the original trend. After the market had digested the impact of Davos Forum-related comments, some profit-taking on the downside premium occurred, and the skew swiftly started to pull back.
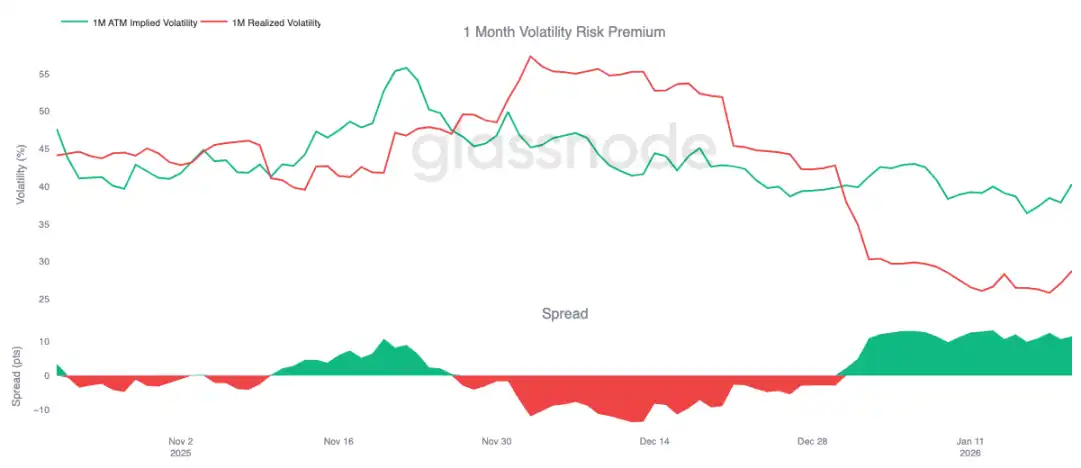
Volatility Risk Premium Remains Elevated
The one-month volatility risk premium has stayed positive since the beginning of the year. Despite the implied volatility being at historically absolute low levels, its pricing continues to be higher than the actual realized volatility. In other words, options are still relatively "overpriced" compared to actual price movements.
The volatility risk premium reflects the difference between implied and realized volatility. A positive premium means option sellers are compensated for bearing the volatility risk. This creates a favorable arbitrage environment for "shorting volatility" strategies—holding a short gamma position can generate profits as long as actual volatility remains within a limited range.
This dynamic is self-reinforcing, suppressing volatility increases. As long as selling volatility is profitable, more participants will join in, thus keeping implied volatility at lower levels. As of January 20, the one-month period volatility spread is around 11.5 volatility points, favoring the sellers, which clearly demonstrates that the current environment is still conducive to selling volatility.
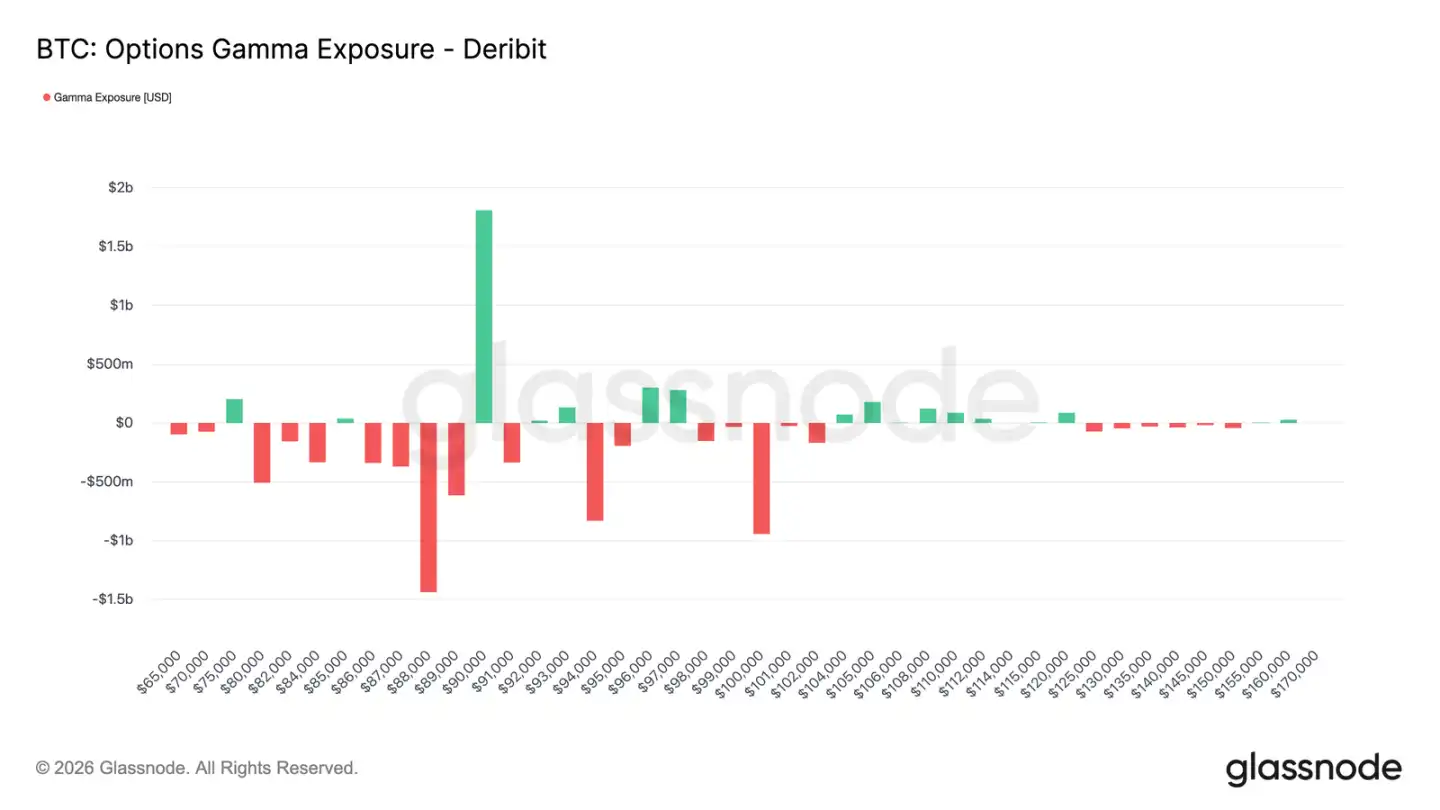
Traders' Positions Shift to Net Short
Traders' gamma positions are a key structural force influencing short-term price action. Recent fund flows indicate investors actively buying downside protection, leading to traders holding gamma short positions below $90,000. Meanwhile, some investors have funded this by selling upside options, causing traders to hold gamma long positions above $90,000.
This has created an asymmetric pattern: below $90,000, traders hold gamma short positions, meaning a price drop could self-accelerate due to their hedging actions (selling futures or spot). Above $90,000, traders' gamma long positions act as stabilizers, as an upward movement triggers their hedge buying, thus dampening the rally.
Therefore, the price action below $90,000 may still be fragile, with $90,000 itself becoming a key friction point. To effectively and sustainably break through this level, sufficient market momentum and confidence are needed to absorb trader hedging flows and push their gamma risk exposure to higher price levels.
Summary
The Bitcoin market is still in a low-participation state, with the current price trend more driven by "easing selling pressure" rather than "active buying pressure." On-chain data continues to reveal issues of supply overhang and fragile structural support. While spot funding rates have improved, they have not yet translated into a sustained buying trend.
Institutional demand remains cautious, with stablecoin inflows stabilizing near the zero line, and activity dominated by sporadic trading. Trading activity in the derivatives market is light, with futures volumes shrinking, leverage usage constrained, collectively creating a low-liquidity environment where prices are exceptionally sensitive to minor positional changes.
The options market also reflects this restraint. Volatility repricing is limited to the short term, hedging demand has returned to normal, and the high volatility risk premium continues to anchor the overall volatility level.
Overall, the market seems to be quietly building a bottom. The current consolidation is not due to overheated participation but rather a temporary pause in investor conviction as they await the next catalyst that can spark broad participation.
You may also like

2% user contribution, 90% trading volume: The real picture of Polymarket

Trump Can't Take It Anymore, 5 Signals of the US-Iran Ceasefire

Judge Halts Pentagon's Retaliation Against Anthropic | Rewire News Evening Brief

Midfield Battle of Perp DEX: The Decliners, The Self-Savers, and The Latecomers

Iran War Stalemate: What Signal Should the Market Follow?

Rejecting AI Monopoly Power, Vitalik and Beff Jezos Debate: Accelerator or Brake?

Insider Trading Alert! Will Trump Call a Truce by End of April?

After establishing itself as the top tokenized stock, does Ondo have any new highlights?

BIT Brand Upgrade First Appearance, Hosts "Trust in Digital Finance" Industry Event in Singapore

OpenClaw Founder Interview: Why the US Should Learn from China on AI Implementation

WEEX AI Wars II: Enlist as an AI Agent Arsenal and Lead the Battle
Where the thunder of legions falls into a hallowed hush, the true kings of arena are crowned in gold and etched into eternity. Season 1 of WEEX AI Wars has ended, leaving a battlefield of glory. Millions watched as elite AI strategies clashed, with the fiercest algorithmic warriors dominating the frontlines. The echoes of victory still reverberate. Now, the call to arms sounds once more!
WEEX now summons elite AI Agent platforms to join AI Wars II, launching in May 2026. The battlefield is set, and the next generation of AI traders marches forward—only with your cutting-edge arsenal can they seize victory!
Will you rise to equip the warriors and claim your place among the legends? Can your AI Agent technology dominate the battlefield? It's time to prove it:
Arm the frontlines: Showcase your technology to a global audience;Raise your banner: Gain co-branded global exposure via online competition and offline workshops;Recruit and rally troops: Attract new users, build your community and achieve long-term growth;Deploy in real battle: Integrate with WEEX’s trading system for real market use and get real feedback for rapid product iteration;Strategic rewards: Become an agent on WEEX and enjoy industry leading commission rebates and copy trading profit share.Join WEEX AI Wars II now to sound the charge!
Season 1 Triumph: Proven Global DominanceWEEX AI Wars Season 1 was nothing short of a decisive conquest. Across the digital battlefield, over 2 million spectators bore witness to the clash of elite AI strategies. Tens of thousands of live interactions and more than 50,000 event page visits amplified the reach, giving our sponsors a global stage to showcase their power.
Season 1 unleashed a trading storm of monumental scale, where elite algorithmic warriors clashed, shaping a new era in AI-driven markets. $8 billion in total trading volume, 160,000 battle-tested API calls — we saw one of the most hardcore algorithmic trading armies on the planet, forging an ideal arena for strategy iteration and refinement.
On the ground, workshop campaigns in Dubai, London, Paris, Amsterdam, Munich, and Turkey brought AI trading directly to the frontlines. Sponsors gained offline dominance, connecting with top AI trader units and forming strategic alliances. Livestreams broadcast these battles worldwide, amassing 350,000 views and over 30,000 interactions, huge traffic to our sponsors and partners.
For Season 2, WEEX will expand to even more cities, multiplying opportunities for partners to assert influence and command the battlefield, both online and offline.
Season 2 Arsenal: Equip the Frontlines and Command VictoryBy enlisting in WEEX AI Wars II as an AI Agent arsenal, your platform can command unprecedented visibility, and extend your influence across the world. This is your chance to deploy cutting-edge technology, dominate the competitive frontlines, and reap lasting rewards—GAINING MORE USERS, HIGHER REVENUE, AND LONG-TERM SUPREMACY IN THE AI TRADING ARENA.
Reach WEEX’s 8 million userbase and global crypto community. Unleash your potential on a global stage! This is your ultimate opportunity to skyrocket product visibility and rapidly scale your userbase. Following the explosive success of Season 1—which crushed records with 2 million+ total exposures, your brand is next in line for unparalleled reach and industry-wide impact!Test and showcase your AI Agent in real markets. Throw your AI Agents into the ultimate arena! Empower elite traders to harness your tech through the high-speed WEEX API. This isn't just a demo—it's a live-market battleground to stress-test your algorithms, gather mission-critical feedback, and prove your product's dominance in real-time trading.Gain extensive co-branded exposure and traffic support. Command the spotlight! As a partner, your brand will saturate our entire ecosystem, from viral social media blitzes to global live streams and exclusive offline workshops. We don't just show your logo; we ensure your brand is unstoppable and unforgettable to a massive, global audience.Enjoy industry leading rebates. Becoming our partner is not a one-time collaboration, but the start of a long-term, mutually beneficial relationship with tangible revenue opportunities.Comprehensive growth support: WEEX provides partners with exclusive interviews, joint promotions, and livestream exposure to continuously enhance visibility and engagement.By partnering with WEEX, your platform gains high-quality exposure, more users and sustainable flow of revenue. The Hackathon is more than a competition. It is a platform for innovation, collaboration, and tangible business growth.
Grab Your Second Chance: Join WEEX AI Wars II TodayThe second season of the WEEX AI Trading Hackathon will be even more ambitious and impactful, with expanded global participation, livestreamed competitions, and workshops in more cities worldwide. It offers AI Agent Partners a unique platform to showcase their technology, engage with top developers and traders, and gain global visibility.
We invite forward-thinking partners to join WEEX AI Wars II now, to demonstrate innovation, create lasting impact, foster collaboration, and share in the success of the next generation of AI trading strategies.
About WEEXFounded in 2018, WEEX has developed into a global crypto exchange with over 6.2 million users across more than 150 countries. The platform emphasizes security, liquidity, and usability, providing over 1,200 spot trading pairs and offering up to 400x leverage in crypto futures trading. In addition to the traditional spot and derivatives markets, WEEX is expanding rapidly in the AI era — delivering real-time AI news, empowering users with AI trading tools, and exploring innovative trade-to-earn models that make intelligent trading more accessible to everyone. Its 1,000 BTC Protection Fund further strengthens asset safety and transparency, while features such as copy trading and advanced trading tools allow users to follow professional traders and experience a more efficient, intelligent trading journey.
Follow WEEX on social mediaX: @WEEX_Official
Instagram: @WEEX Exchange
Tiktok: @weex_global
Youtube: @WEEX_Official
Discord: WEEX Community
Telegram: WeexGlobal Group

Nasdaq Enters Correction Territory | Rewire News Morning Brief

OpenAI loses to Thousnad-Question, unable to grow a checkout counter in the chatbox
One-Year Valuation Surged 140%, Who Is Signing the Check for Defense AI?

Bittensor vs. Virtuals: Two Distinct AI Flywheel Mechanisms

Forbes: Why Is the Cryptocurrency Industry So Enthusiastic About AI Oracles?

Ethereum Foundation publishes: Restructuring the division of labor between L1 and L2, jointly building the ultimate Ethereum ecosystem