Interpreting the on-chain data timestamp: an important basis for judging the transition of the bull market cycle
Original title: "Important basis for judging the transition of the bull market cycle - the timestamp of on-chain data"
Original author: Murphy, on-chain data analyst
There are 2 core concepts in the on-chain data analysis of BTC, namely "timestamp" and "price stamp". The transparency of the blockchain allows us to observe each on-chain transaction and identify two key details: 1. The time when the chip movement occurs: timestamp; 2. The price when the transaction occurs: price stamp;
When we analyze the transition of stage trends, the data used, such as turnover cost, profit realization, demand inflow, hot supply, etc., are mainly based on "price stamp". If we want to observe and analyze the timeliness of the BTC cycle, we need to use "timestamp" more.
Each BTC exists in a certain UTXO, and the timestamp function of UTXO means that each BTC has an age, which does not refer to the time when it was mined, but the time from the last move to the present.
We can distinguish BTCs of different ages by the length of time, for example, they can be divided into 1 week-1 month (1w-1m), or 1-2 years (1-2y), etc. Usually we classify BTCs that have not been moved for more than 6 months (more than 155 days to be precise) or more as long-term holders (LTH) chips, and the rest are classified as short-term holders (STH) chips.
Looking back at the entire development history of BTC, every time there is a bull market cycle, LTH distributes chips to STH; at this time, the proportion of wealth owned by the "old coin group" begins to gradually decline (as shown by the green dotted line in Figure 1);
(Figure 1)
In the bear market, the chips return from STH to LTH, and the proportion of wealth owned by the "new coin group" begins to gradually decline (as shown by the green dotted line in Figure 2);
(Figure 2)
It can be seen that the waveforms in Figure 1 (old coin) and Figure 2 (new coin) are exactly opposite, I call this BTC The "pendulum effect" of the big cycle; the market always follows this endogenous law under the transformation of supply and demand, just like a pendulum, repeating over and over again.
In the large LTH group, the group that has the greatest impact on the cycle transition and even plays a decisive role is the 1-2y and 2-3y coin age chips (diamond hands in the cycle). We can roughly infer the "timestamp" of this round of bull market cycle by observing the changing trend of this data.
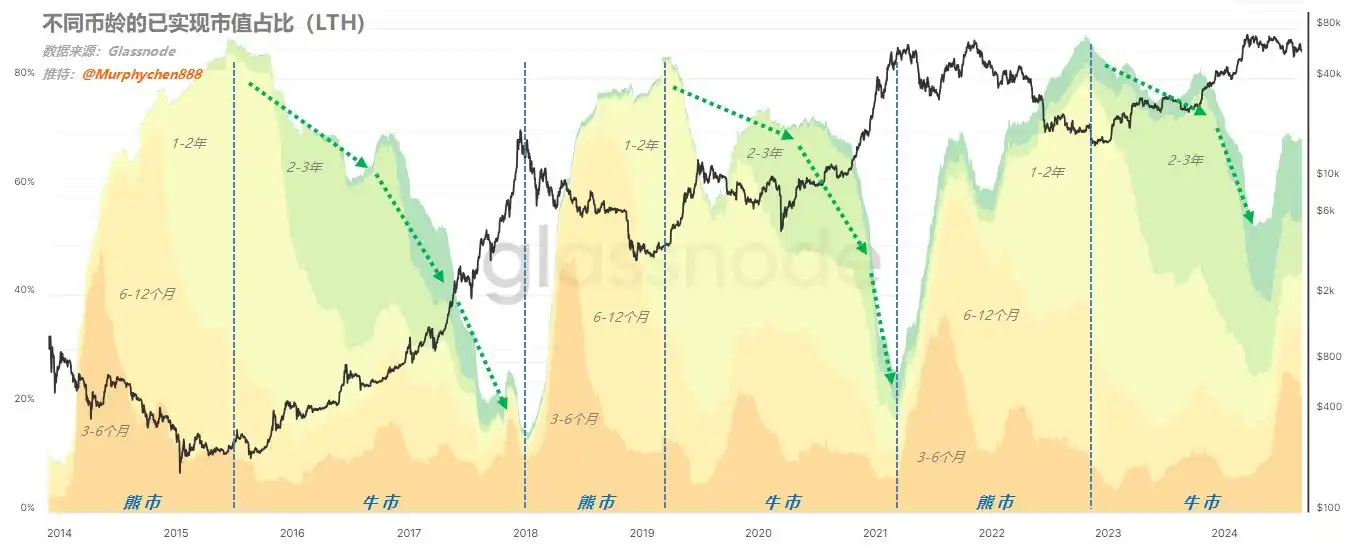
Figure 3 below is the realized market value share data of 1-2y & 2-3y. Let's take a look at the overall situation first. Whenever the yellow (1-2y) and green (2-3y) waveforms reach their peaks, it means that the market is about to exit the bear market and enter the early stages of the bull market. As time goes by, the waveform begins to gradually decline, indicating that the group is distributing chips to new investors entering the market.

(Figure 3)
When the waveform drops to the bottom and the slope begins to slow down, it means that the market is in the middle and late stages of the bull market, which can also be considered the "top range" of the bull market. It should be noted that these two groups are the most experienced investors in the market. For example, the BTC purchased by MSTR three years ago, from December 2021 to January 2022, belongs to this group. When I bought it, it was STH, and today it has become LTH.
The current data has dropped from a peak of 56% to 12.3% (green dotted line in the figure), while the lowest values of the ratio in the previous two cycles were 1.3% (17-18 cycles) and 6.6% (21-22 cycles). Considering that more and more cross-cycle institutional investors like MSTR are joining the coin holding group, I think the lowest value of 1-2y & 2-3y in this cycle should be higher than 6.6% in the previous cycle, and it is expected to be between 7% and 10% with a high probability.
If we draw a standard line based on the current value (point A) (see the red dotted line in Figure 1), we can see that in the first two cycles, when the indicator dropped to the same position, the price of BTC was in the top range, and the relative position was in the middle and late stages of the bull market. As time goes by, the curve gradually hits the bottom and starts to turn upward, and when it returns to the original height again (point B), it usually means that the bull market is over.
From A to B is a "smile curve". The whole process took 17 months in the 17-18 cycle, and 12 months in the 21-22 cycle. According to the above analysis, the bottom of this cycle is likely to be higher than 6.6%. Therefore, I think the total duration of the "smile curve" is less than or equal to 12 months (entering a bear market) is more likely.
At the same time, we can see that in the 17-18 cycle, the time from point A to the last high point of the cycle is 6 months (Figure 3 Mark 1); the time from point A to the last high point of the cycle in the 21-22 cycle is 10 months (Figure 3 Mark 2).
Since the 17-18 cycle is a very special sharp-angled top, it is less referenceable; the 21-22 cycle double top cycle should be more worthy of reference; therefore, I think that the time period from the current point A to the future point B in this cycle is less than/equal to 10 months, perhaps about 9-10 months.
If this inference is true, then the end of this round of bull market cycle will roughly occur between September and October 2025.
Note! All the above probabilistic inferences are only my personal subjective opinions, not objective feedback from data!
After talking about the relationship between currency age conversion and cycle, let's observe from another angle - metaphysics! Three-line co-frequency resonance curve
I roughly counted that the frequency of mentioning the "three-line integration" indicator was the highest in the questions sent to me in the background. Friends seem to be very obsessed with this; although I know that this indicator has shown magical accuracy many times in this cycle, I still think that we should not put the cart before the horse. We should look at the objective data first, and then use the "three lines in one" for reference.

(Figure 4)
Based on the information feedback in the figure, I give the following more subjective interpretations. Friends, please look at it rationally and should not use it as the only basis for judgment!
1. At present, the red line has reached a critical turning point. From the position point of view, the red line is closer to the blue line, and it is a little distance away from the upper green line, and there is no consistency in the adhesion of the three lines.
That is to say, from mid-to-late December to mid-January, there will be 3 possible deviations: continue to break new highs (Figure 4 Mark 1)/consolidation (Figure 4 Mark 2)/pullback (Figure 4 Mark 3); but from the overall trend, the green line and the blue line are both in a pullback state during this stage. Therefore, I personally think that the probability of 3 and 2 is greater than 1;
Emotionally, I prefer 2, and 1 is the least likely; of course, a moderate pullback will also be more conducive to the continuation of this round of trends.
2. Many of you may remember that in my previous analysis of the "three-line integration" indicator, I mentioned: "Around 2024.12-2025.1, MVRV will have a sharp correction." At present, from the comprehensive observation of other on-chain data, this so-called "significant" may not be as big as imagined. There are two reasons:
a. In the current on-chain chip structure distribution, a huge column of 600,000 BTC is formed at $97,000, and there are nearly 2 million BTC accumulation in the 9.4w-10w US dollar range, creating a potential support range.
b. Judging from the current new demand data, although there has been a decline, it has not dropped below the zero axis quickly. In other words, there is still a certain scale of demand in the market, and it can maintain a certain degree of balance.
3. The green and blue lines in the figure are glued at the mark 4, and the glued position is significantly higher than the current (mark 4 in Figure 4), which means that there will be another wave of market in March-April 2025.
According to the current "on-chain average turnover cost" and "active investor average cost" data, I calculated that the price of BTC in March-April has a certain probability of reaching more than 120,000 US dollars, but not more than 150,000 US dollars (since the turnover cost will change, this calculation needs to be calibrated every 2 weeks).
4. If this wave of rebound occurs in March-April, it may be the end of this round of trend market, and the future depends on the changes in macro policies.
5. After this, the market may enter a 4-5 month long consolidation period (as marked 5 in the figure). In the early stage of this stage, the green line and the blue line are consistent and downward; but in the middle, they begin to separate, so there is also great uncertainty here. But in general, the high point of the wide range of consolidation will not exceed the peak of March-April.
6. There will be the last wave of this cycle in September-October 2025 (marked 6 in the figure). At the beginning of this stage, the green line and the blue line are separated greatly. If the red line is close to the blue line at that time, the high point of this wave of market will be higher than the peak of March-April; if the red line is close to the green line, the high point will be lower than the peak of March-April.
At the same time, we can see that the green and blue lines are glued together in the part circled by the red dotted line, and the position here is lower than the peak of March-April. Perhaps it means that the high point of September-October is more likely to be lower than the high point of March-April.
Interestingly, the conclusion of observing the "metaphysical indicator" is highly consistent with the conclusion of the temporal inference of currency age conversion mentioned above. If this is true, it means that the highest point of this cycle will appear in March-April 2025, and the high point in September-October 2025 will be the last "top" of this cycle, and the height may not be higher than the previous one (I personally prefer to be close to the previous high, not necessarily much higher).
From a trading perspective, once entering the top range, I still insist on firmly implementing trading discipline and making a batch profit-taking plan as long as there is a signal of phased attenuation, even if there may be higher highs later (this is a matter of probability). After BTC stops profit, some of the positions vacated may be considered to switch to some high-quality ALTs, and strive to find a second growth curve that outperforms the big cake in the second half of the bull market.
The data shared in this article is only for learning and research, not as investment advice.
You may also like

Morning Report | BitMine increased its holdings by 126,971 ETH last week; trader Eugene announced his exit from the crypto market

Wang Chuan: How can one not feel anxious after the neighbor Old Wang made thirty times profit by investing in storage stocks? (Seven) - A quarter-century cycle

Cryptocurrency CEXs are flocking to sell US stocks, and traditional brokerages are facing an "uninvited guest."

$75 billion in foreign capital has fled, and South Korean retail investors have absorbed it all using leverage

Japan’s Three Megabanks Plan Joint Stablecoin Issuance in Fiscal 2026
MUFG, SMBC, and Mizuho reportedly plan to jointly issue fiat-pegged stablecoins in fiscal 2026, signaling Japan’s growing push into bank-led digital payment infrastructure.

Humanity Discloses H Token Dual-Chain Attack Details, With Losses on Ethereum and BSC Exceeding $36 Million
Humanity said the H token attack across Ethereum and BSC caused more than $36 million in losses after leaked ProxyAdmin keys enabled malicious contract upgrades and token minting.
White House Discusses CLARITY Act With Law Enforcement Ahead of Senate Vote
The White House discussed the CLARITY Act with law enforcement ahead of a Senate vote, focusing on illicit finance risks and developer protections.

Bitcoin Trading Guide 2026: Strategies for Experienced Traders

What Is XAUT and PAXG? Why Tokenized Gold Is Booming in 2026

Will the SpaceX IPO Hurt Bitcoin? Here's What Traders Are Watching

Foreign selling in the South Korean stock market accelerates, with cumulative net sales reportedly reaching $75 billion this year
On June 9, The Kobeissi Letter, citing Goldman Sachs data, reported that global investors are selling South Korean stocks at an unusually rapid pace. In the latest trading session, foreign investors sold about $801 million worth of Kospi constituent stocks again; total foreign outflows last week reached about $10 billion, and the market has been in net foreign selling on nearly every trading day over the past month. According to the data cited in the report, foreign investors have sold about $75 billion worth of South Korean stocks so far this year. Meanwhile, South Korean retail and institutional investors together recorded roughly $69 billion in net buying over the same period, suggesting that the market’s main buying support has come from domestic capital rather than returning overseas funds. The information currently disclosed still mainly comes from The Kobeissi Letter’s retelling and Goldman Sachs data summaries, while public details on the statistical period and the specific definition of “selling” remain relatively limited.

Fortune Warns of Strategy’s Financing Structure Risks as Bitcoin Premium Narrows
Fortune warned that Strategy’s Bitcoin treasury model faces growing financing risks as MSTR’s net asset premium narrows and preferred stock dividend pressure increases.

Ferrari Challenge Le Mans: Carl Moon to Dominate in WEEX Livery

Sahara AI Responds to SAHARA’s Sharp Drop: No Contract or Product Security Issues Found, Internal Investigation Underway
Sahara AI responded to SAHARA’s 60% price drop, saying no token contract or product security issues have been found and an internal investigation is underway.

WEEX Deposit/Withdrawal Dynamic Island: Your Asset Status, Always in Sight
Scaling Crypto Derivatives: The Digital Asset Infrastructure Behind High-Volume Trading
In the fast-moving digital asset ecosystem, derivatives platforms face an extreme architectural test. High-leverage futures markets demand more than just standard security—they require absolute operational precision, zero-latency matching engines, and ironclad structural scalability, all while navigating intense market volatility.
As global platforms scale to meet these demands, the industry is shifting away from rigid, monolithic setups toward a more agile, "decoupled" infrastructure philosophy.
The Blueprint for High-Volume Copy TradingFor elite global exchanges like WEEX (founded in 2018), this architectural choice becomes critical when scaling high-volume retail features like social copy trading. When thousands of users automatically mirror the real-time strategies of elite traders simultaneously, it triggers sudden, monumental spikes in concurrent transactional volume.
To prevent execution latency or settlement bottlenecks during these peak volatility events, a platform's primary engine must remain entirely dedicated to risk management, copy-trade synchronization, and order matching.
The Architectural Rule: New-generation platforms must separate front-end user execution engines from heavy backend infrastructural overhead to eliminate operational friction.
By separating these layers, platforms can maintain complete sovereignty over their trading environments and user experiences while strategically aligning with institutional-grade infrastructure ecosystems. This strategic framework allows modern exchanges to leverage advanced Digital Asset Custody infrastructure such as Cobo’s behind the scenes, ensuring that backend wallet management scales elastically alongside trading spikes.
Capitalizing on Market Momentum and 400× LeverageIn a derivatives arena where platforms offer up to 400× leverage on perpetual contracts, capital efficiency and market agility are core business metrics. To capture market momentum, an exchange needs the ability to rapidly expand its asset offerings, supporting everything from legacy crypto assets to sudden, trending altcoins across a massive library of trading pairs.
Adopting a flexible, scalable Wallet-as-a-Service (WaaS) solution such as Cobo’s could completely rewrite the development timeline for high-growth exchanges. Instead of spending months of engineering capital building out custom backend wallet architectures for every new blockchain network, platforms can deploy localized infrastructure in days.
This agility allows platforms to instantly scale their listings to over a thousand trading pairs without compromising security or delaying time-to-market. It mirrors the exact operational advantages seen during high-velocity market events, similar to how advanced wallet infrastructure empowers platforms during sudden asset surges; allowing exchanges to pass that speed and liquidity directly to their global user base.
A Mature Foundation for GrowthThe synergy between trusted infrastructure ecosystems and global trading platforms represents the natural evolution of a maturing crypto market. As WEEX continues to scale its global spot and derivatives offerings for over 6 million users, adopting robust backend paradigms proves that platforms no longer have to compromise between cutting-edge trading velocity and uncompromised structural security.

Get Paid to Onboard? Try WEEX’s New Homepage with Rewards for Registration, Deposit & Trade
WEEX Custom Layout: Build Your Perfect Trading Workspace in Seconds
Morning Report | BitMine increased its holdings by 126,971 ETH last week; trader Eugene announced his exit from the crypto market
Wang Chuan: How can one not feel anxious after the neighbor Old Wang made thirty times profit by investing in storage stocks? (Seven) - A quarter-century cycle
Cryptocurrency CEXs are flocking to sell US stocks, and traditional brokerages are facing an "uninvited guest."
$75 billion in foreign capital has fled, and South Korean retail investors have absorbed it all using leverage
Japan’s Three Megabanks Plan Joint Stablecoin Issuance in Fiscal 2026
MUFG, SMBC, and Mizuho reportedly plan to jointly issue fiat-pegged stablecoins in fiscal 2026, signaling Japan’s growing push into bank-led digital payment infrastructure.
Humanity Discloses H Token Dual-Chain Attack Details, With Losses on Ethereum and BSC Exceeding $36 Million
Humanity said the H token attack across Ethereum and BSC caused more than $36 million in losses after leaked ProxyAdmin keys enabled malicious contract upgrades and token minting.
