 Buy Crypto
- Markets
 Futures
- Spot
- Copy Trade
- Earn
- More
Mantle Price Forecast: Anticipated Drop by December 15, 2025
Key Takeaways
- The Mantle (MNT) token is on a predicted downward trend, likely experiencing a price decrease to approximately $0.890459 by December 15, 2025.
- Despite a short-term gain of 3.17% against the US Dollar, the long-term perspective for Mantle remains bearish.
- Currently, the Mantle market is characterized by fear, reflective of current economic sentiments and investor hesitancy.
- Key technical indicators and resistance levels suggest potential resistance at $1.15, $1.19, and $1.22 with crucial support marked at $1.08, $1.05, and ultimately $1.02.
WEEX Crypto News, 2025-12-12 08:38:17
Understanding the Mantle Price Forecast
As cryptocurrency enthusiasts and investors, closely following Mantle’s price and analyzing market trends has become a frequent activity. This analysis revolves mainly around predicting a potential price plummet of the Mantle (MNT) token from its current trading value of $1.15 to as low as $0.890459 within five days. This anticipated decline accounts for a significant 23.58% drop. The projected downturn reflects broader sentiments surrounding MNT, encapsulated by an overarching bearish aura prevalent in its market activities.
To appreciate the complexity of such forecasts, it is crucial to parse through various elements influencing the token’s trajectory. This includes quantitative statistical trends, qualitative market sentiments, and comprehensive technical analyses, each painting a picture of Mantle’s immediate future in the crypto market.
Market Sentiments and Recent Performance
In the cryptocurrency sector, investor sentiment often swings between greed and fear. At present, the Fear & Greed index, a measure of the emotional conditioning of market participants, reads at 26. This score indicates a predominant fear within the market, insinuating investors’ reluctance towards aggressive trading maneuvers. Historically, a “Fear” reading can suggest a buying opportunity, yet it also speaks volumes about prevailing investor uncertainty and market volatility.
Despite having surged 3.17% against the US Dollar, Mantle’s broader picture displays challenging trends. Over the past 30 days, MNT shed 14.38%, further illustrating a steady decline across a longer timeline with a year-on-year decrease of 2.39%. When juxtaposed against the peak price of $2.85 recorded on October 9, 2025, today’s valuation signifies a continued descent. Short-term gains may appear encouraging; however, they are overshadowed by consequential losses.
Technical Analysis and Future Speculations
Dissecting the technical indicators for Mantle offers a clinical lens to anticipate future price trends. What stands out is the alignment of twelve indicators supporting a bullish prediction, overshadowed by fifteen indicators signifying a bearish outlook — leading to an overall bearish sentiment. Such a dichotomy reflects the broader trend analysis.
Critical support levels for Mantle are positioned at $1.08, $1.05, and $1.02. Breaching these points would ostensibly strengthen the bearish signal. In terms of resistance, the present value of $1.15, alongside future potential hurdles at $1.19 and $1.22, form resistant ceilings that MNT must surpass for a bullish turnaround. Such resistance and support levels are pivot metrics within the graphical representation of Mantle’s proportional distribution, allowing for strategic insights crucial for informed trading decisions.
Moving Averages and Price Oscillators
Delving into moving averages (MAs), noted metrics include (but are not limited to) Daily Simple and Daily Exponential Averages. As Mantle oscillates through various thresholds, the moving average crossovers serve as bars to determine sentiment shifts. The 50-day SMA (Simple Moving Average), reflects Mantle closing above its current line, implying a fleeting bullish sentiment. Meanwhile, the 200-day SMA is bleak, with Mantle trading below it, affirming a bearish trend.
These crossover points, coupled with metrics like RSI (Relative Strength Index) — at 49.14 suggesting neutrality, and other oscillators like MACD (Moving Average Convergence Divergence), further dictate market behavior. On diverging stanchions with mantles like VWMA (Volume Weighted Moving Average) and Oscillator analyses, signals delineate potential buy or sell motions that correlate strictly with historic trading patterns.
Broader Crypto Market Context
Within this broader cryptocurrency discussion, the macro landscape encapsulates an undulating market. A total market cap hovering around $3.13T (-0.38%) with BTC dominance at 58.91% (0.41%) signifies an overarching market shift where larger cryptocurrencies dictate micro-level movements. This framework guides Mantle’s contextual analysis against other major tokens, foreseeing strains in its market penetration.
As financial equity like the S&P 500 at 6,902.1 (0.22%) and asset-backed commodities like Gold at $4,279.98 (1.25%) vie for investor attention, cryptocurrency, marked by speculative promise, continues to juxtapose traditional investments as volatile yet potentially lucrative ventures.
Mantle’s Immediate Forecast
Final prognostications for Mantle involve meticulous scrutiny of these myriad factors. Accounting for the present indicators and forecasted to stretch into the five-day prediction timeline, Mantle’s trajectory faces probable orange flares. As traders and investors closely monitor this dynamic market — ostensibly scrutinizing real-time data, sentiment indexes, and alignment with broader market echelon, the takeaway remains to stay vigilant yet cautiously opportunistic.
While Mantle’s present strategy indicates a sell-off trajectory, investors versed in crypto markets appreciate the unpredictable yet pliable nature of digital assets. Market sentiment can pivot unexpectedly, requiring stakeholders remain updated with WEEX’s toolsets as integral assets on interfaces that emphasize real-time responsiveness and portfolio agility.
FAQs
What is the current forecast for Mantle?
As of the latest analysis, Mantle is expected to experience a price decrease to approximately $0.890459 by December 15, 2025. This indicates a bearish trend primarily influenced by recent market sentiments and technical indicators that suggest continued volatility.
How does the Fear & Greed Index impact Mantle?
The Fear & Greed Index at 26 reflects a market conditioned by fear, often imbuing cautious trading. It symbolizes investors’ hesitance to make vigorous moves, suggesting a potential buying opportunity during hesitant market phases.
What are the key levels for Mantle traders to watch?
In navigating Mantle’s trading journey, crucial levels include support marks at $1.08, $1.05, and $1.02 with resistance outlined at $1.15, $1.19, and $1.22. Surpassing these tiers critically dictates the token’s successive market position.
Why is there a bearish sentiment for Mantle?
The bearish sentiment emerges from multifaceted indicators, where more forecasts indicate price declines than those that signal growth. This situation underscores bearish trends evident from past performance metrics and market analyses.
What role do moving averages play in forecasting Mantle’s price?
Moving averages provide insights into the token’s past performance, giving indicators of momentum and trend shifts. Simple and exponential averages, along with oscillators like MACD, serve as technical barometers for predicting Mantle’s potential market directions.
You may also like

Morning Report | Strategy increased its holdings by 4,871 BTC last week; Toss plans to develop its own blockchain and issue a native cryptocurrency; OpenAI's CFO privately questioned the timing of the IPO in 2026

Research: Stablecoins have a trading volume of 35 trillion a year, how much of it is real payment?

Galaxy Research: AI agents are giving rise to new species on the blockchain, how zero-human companies activate the financial flywheel

Data Research: How big is the liquidity gap between Hyperliquid and CME crude oil?

Why Are GPU Prices Skyrocketing Out of Control?

How to Master Claude Cowork Completely?

70-Page Confidential Letter Alleges First Charge of 'Lying,' Altman Tells Board 'I Can't Change My Personality'
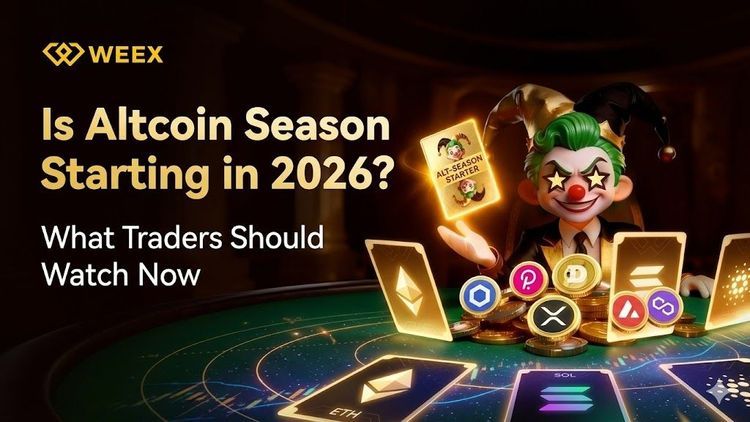
Is Altcoin Season Starting in 2026? What Traders Should Watch Now
Altcoin season signals are becoming clearer in 2026 as capital rotation across crypto markets accelerates. Here’s what traders should watch and how strategy-based participation is evolving in the current market cycle.
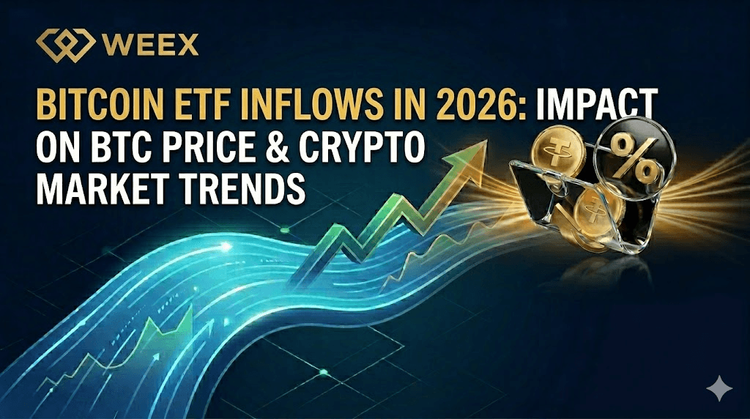
Bitcoin ETF Inflows in 2026: Impact on BTC Price and Crypto Market Trends
Bitcoin ETF inflows are reshaping BTC price trends and crypto market liquidity in 2026. See how institutional capital is influencing volatility, trading behavior, and portfolio allocation strategies across crypto markets.
Visa's Stablecoin Strategy: Cards, Settlement, and the Future

Stock Market Split

How to capture the next Alpha in the narrative of predictive markets?

"Legal" Ponzi scheme? Unveiling the circular lending of Gemini exchange and its founder

The first stock of stablecoins, Circle, has officially launched the new public chain ARC points system, and the interactive guide is here

Oil prices are approaching a critical point. What will happen in mid-April?
The oil price is approaching a critical point, what will happen in mid-April?

Mechanism drives value, deflation leads the future: MIAU will officially launch on PancakeSwap on April 13
