On-Chain Data School (Part Four): Visualizing BTC UTXO Age Price Distribution Chart


Original Article Title: "On-chain Data Classroom (Part 4): Visualizing the $BTC Chip Price Distribution Chart "
Original Article Author: Mr. Berg, On-chain Data Analyst
This article is the 4th in the On-chain Data Classroom series, which consists of 10 articles in total. Take you step by step to understand on-chain data analysis. Interested readers are welcome to follow this series of articles.
Related Reading: "On-chain Data Classroom (Part 3): Have the Bottom Fishing Whales Taken Profit?"
TLDR
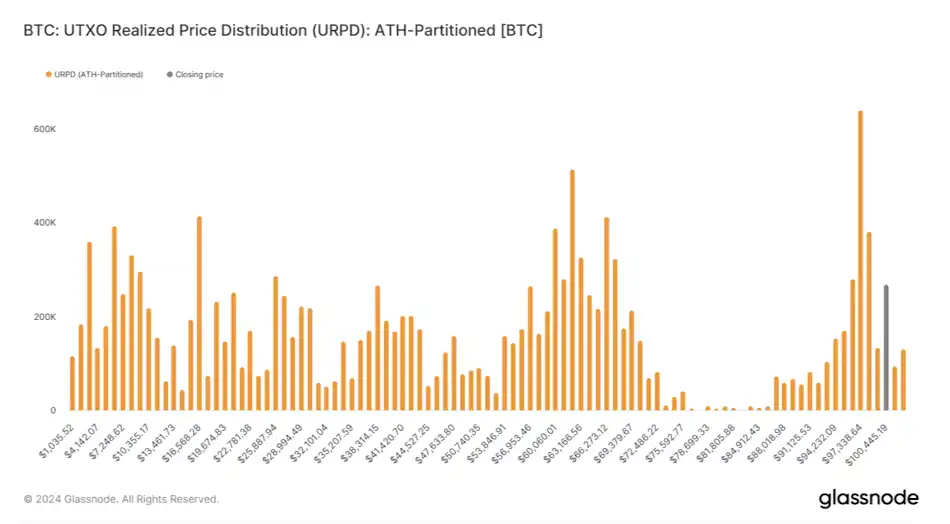
- This article will introduce the on-chain metric URPD
- URPD shows the distribution of $BTC chips at different holding costs
- URPD can be used to observe chip turnover, distribution conditions, and provide guidance on trends
What is URPD?
URPD, short for UTXO Realized Price Distribution.
Due to BTC's unique UTXO blockchain structure,
we can track data on-chain that is unavailable in traditional financial markets.
The URPD chart is an indicator derived from this principle,
where we can see the number of chips corresponding to each price level on the chart,
equivalent to showing the "buying cost of each $BTC."
URPD, Chip Turnover, Accumulation, and Distribution
After understanding the concept of URPD,
we can then observe the turnover of chips at different price levels based on the daily URPD changes.
For example:
Chart one below is the URPD chart for May 1,
while chart two is the URPD chart for October 1.
After experiencing five months of wide-ranging fluctuations in price,
It is quite obvious to see the phenomenon of low-cost chips being distributed upwards.

URPD, Chip Turnover, Accumulation, and Distribution (2)
In history, at a market top, it is usually accompanied by the tail end of high-profit low-cost chip distribution;
while at a market bottom, a large amount of chips can be seen accumulating in a relatively narrow range.
Therefore, in analysis,
URPD is often observed together with other data (such as realized profit, MVRV, etc.),
integrating logical thinking to understand the market from a more comprehensive perspective.

Support, Resistance, Consensus
When a significant amount of chips begins to accumulate in a single price range,
it indicates that a supply-demand consensus has gradually formed in that range.
Once the price later rapidly rises out of that range,
due to the high turnover of chips in that range,
it is likely to provide support in the future;
Conversely, if the price falls below that range,
the chips in that range will become trapped chips,
which may act as resistance levels in future price increases.
Conclusion
The above is all the content of On-Chain Data School (Part Four). For readers interested in delving deeper into on-chain data analysis, remember to keep track of this series of articles!
If you want to see more analysis and educational content on on-chain data, feel free to follow my Twitter handle (X)!
Hope this article has been helpful to you. Thank you for reading.
You may also like

Why Is Bitcoin Down Today? What the Hawkish FOMC Means for SpaceX, Gold and Nasdaq

OKX Star analyzes Binance's competitive advantages: when regulation levels the playing field, competition has just begun

Full version of the debut Q&A! Federal Reserve Chairman Waller: Sticking to the 2% inflation target, establishing five special working groups, individual did not submit the dot plot

From Disruptor to Shadow Market: The Crypto Market is Becoming a Colony of Traditional Finance

Dalio's important long article: How to position in the current market environment?

DeepSeek Financing Story

Morning Report | Illinois signs the strictest digital asset tax law in the U.S.; RWA tokenization market size surpasses $43 billion, institutions accelerate the migration of on-chain assets
Morning Report | DeepSeek completes over $7 billion in financing, with a valuation exceeding $50 billion; Musk's personal wealth has surpassed the total market value of Bitcoin

Cursor, why did you get on Musk's spaceship?
In the name of charity, for the benefit of the family: How the Trump family turned charity into profit?

Will Gold Break $4,500 After Tonight's Fed Decision? What XAUT and PAXG Traders Need to Know
SharpLink CEO: How to understand that Ethereum developers have just surpassed 1 million?

Morning Report | MiCA grace period expires on July 1; Kalshi's trading volume in the first week of the World Cup breaks $5.1 billion, setting a record

The foundation of SpaceX's trillion-dollar valuation: Who is dividing Musk's annual capital expenditure of tens of billions?
How to exit after asset tokenization?
The stablecoin positioning battle escalates: When compliance is just a ticket to entry, will USD1 become the biggest winner?

A16Z: The sun bears witness, SpaceX is worth 7.5 trillion

