 Buy Crypto
- Markets
 Futures
- Spot
- Copy Trade
- Earn
- More
Pump.fun is Trading 29.22% Above Our Price Projection for December 15, 2025
Key Takeaways
- Pump.fun is currently trading 29.22% above its predicted price for December 15, 2025.
- The digital asset has recently shown a decline, with a 31.81% drop over the past month and a 39.21% decrease since last year.
- Present market sentiment for Pump.fun is bearish, as indicated by technical analysis and the Fear & Greed Index.
- Key support levels for Pump.fun are $0.002928, $0.002791, and $0.002647.
- Technical indicators suggest a potential decrease in Pump.fun’s price by 23.21% within the next five days.
WEEX Crypto News, 2025-12-12 08:36:19
Understanding the Current Market Overview
In the context of the broader cryptocurrency market, Pump.fun is currently experiencing significant volatility. As of now, the total market capitalization stands at $3.16 trillion, marking a slight decrease of 0.77%. Bitcoin, maintaining a dominance rate of 58.44%, saw a minor reduction by approximately 0.05%. This demonstrates the dynamic environment in which Pump.fun operates, as fluctuating market conditions can significantly impact individual coins.
Against the backdrop of this market, Pump.fun is trading at $0.002974, outperforming initial predictions yet witnessing a sharp decrease of 6.20% within a day. In comparison with Bitcoin (BTC) and Ethereum (ETH), Pump.fun maintained a downward trend, recording losses of 4.62% and 5.98%, respectively. Such variations highlight the turbulent nature of crypto trading and the need to continuously monitor market changes.
Market Sentiments and Predictions for Pump.fun
The prevailing sentiment towards Pump.fun remains bearish, supported by technical indicators and market psychology. The Fear & Greed Index, which currently reads 26, suggests that investors harbor trepidation and anxiety towards Pump.fun and the larger cryptocurrency market. Such sentiment is pivotal, as it highlights investor uncertainty and showcases the potential opportunities for cautious buyers.
Technical insights point towards possible declines in Pump.fun’s value. Current prices stand at $0.002974, but predictions suggest a potential fall to $0.002301 by December 15, 2025. This projection reflects a 23.21% prospective decline, demonstrating stark contrasts with Pump.fun’s recent performance.
Historical Performance and Price Trends
Over the past year, Pump.fun demonstrated significant volatility, suggesting its potential for substantial price fluctuations. Historically, Pump.fun reached its peak on September 14, 2025, valued at $0.008791, marking an all-time high. Despite this peak, the recent cycle high and low were $0.003374 and $0.002485, respectively, indicating a substantial price contraction.
In the last month alone, Pump.fun recorded a drop of 31.81%, adding to an existing one-year decline of 39.21%. These patterns highlight the coin’s medium-term bearish trajectory, emphasized by recent market movements. In such a fluctuating environment, the importance of vigilance and timely decision-making becomes evident.
Detailed Technical Analysis
Key Technical Indicators
A rigorous analysis of Pump.fun’s current technical indicators presents a comprehensive picture of its market performance. Primarily, the indicators include moving averages and oscillators which offer insights into present trading trends and potential future movements.
Moving Averages Analysis:
- 3-Day Simple and Exponential Averages: Both the simple and exponential moving averages point towards selling, with values at $0.003106 and $0.003230, respectively.
- 5-Day Simple and Exponential Averages: Similarly indicating a sell position, these averages reflect prices of $0.002986 and $0.003529.
- 10-Day Moving Averages: Display a combination of buy ($0.002962 – simple) and sell ($0.003871 – exponential) signals.
- 21-Day Moving Averages: A mixed indication with buy at $0.002971 (simple) and sell at $0.003873 (exponential).
- The 50-Day Moving Average suggests a sell position, trading at $0.003678 (simple).
Oscillators and Momentum Indicators:
- Relative Strength Index (RSI – 14) stands at 47.91, indicating a neutral position.
- Stochastic RSI (14) shows a strong sell signal at 93.64, emphasizing a potential overbought condition.
- Other indicators like the Commodity Channel Index (66.67) and Awesome Oscillator (0.00) remain neutral, showcasing a balanced momentum in the current scenario.
Emotional Market Sentiments
As with many assets in the crypto domain, emotional and psychological factors have a considerable impact on Pump.fun’s valuation. The Fear & Greed Index currently reflects a state of fear among investors, primarily driven by recent losses and market instability.
Such emotional indices are crucial as they offer insights into investor behavior patterns, which can lead to buying opportunities. During periods of heightened fear, prices may be undervalued, presenting potential for future growth once the market sentiment shifts.
Strategic Conclusions and Potential Scenarios
In summary, Pump.fun’s current market trajectory is characterized by a predominant bearish outlook supported by several technical signals. The coin faces substantial adversity originating from broader market conditions and investor sentiment. Yet, this landscape is not without potential prospects for growth or rebound.
Investors should closely monitor key support levels including $0.002928, $0.002791, and $0.002647, as potential breach of these levels may trigger further declines. Conversely, key resistance points at $0.003210, $0.003355, and $0.003492 are critical to sustaining any upward momentum.
Bearish signals, as emphasized by multiple indicators, imply vigilance and caution as the bankability of Pump.fun remains under question. At this juncture, prudent strategies may involve speculative buy positions powered by meticulous assessment and constant review of market sentiment.
Moreover, it’s imperative to highlight that the cryptocurrency landscape is rife with unanticipated fluctuations. Even established cryptocurrencies demonstrate volatility; hence thoroughly assessing market developments remains pivotal. In such uncertain conditions, expert consultation and timely market evaluations are advised for both new and seasoned investors.
By addressing these considerations, stakeholders can navigate the ongoing turbulence within the Pump.fun market, aligning decisions with outcomes that maximize potential returns while minimizing risks.
Frequently Asked Questions
What is the current price prediction for Pump.fun by December 15, 2025?
According to prevailing predictions, Pump.fun’s price is expected to fall by approximately 23.21%, reaching an estimated value of $0.002301 within the next five days.
How has Pump.fun performed over the past year?
Over the past year, Pump.fun has exhibited significant volatility with a price drop of 39.21%. Its historical peak, recorded on September 14, 2025, was valued at $0.008791, illustrating the coin’s potential for substantial price shifts.
What are the critical support and resistance levels to monitor for Pump.fun?
Support levels to watch include $0.002928, $0.002791, and $0.002647. Key resistance levels to keep an eye on are $0.003210, $0.003355, and $0.003492 as they might influence any upside potential.
What are the indications from the Fear & Greed Index regarding Pump.fun’s market sentiment?
The Fear & Greed Index currently reads 26, indicating a state of fear among investors. This metric suggests investor skepticism towards the market, potentially pointing to buying opportunities amidst lower valuations.
How should investors approach Pump.fun in this market scenario?
Given the current bearish outlook and volatility, investors should remain cautious. Constant monitoring of market trends, consulting advisors, and reassessing strategies are crucial to navigating the ongoing market dynamics associated with Pump.fun.
You may also like

Morning Report | Strategy increased its holdings by 4,871 BTC last week; Toss plans to develop its own blockchain and issue a native cryptocurrency; OpenAI's CFO privately questioned the timing of the IPO in 2026

Research: Stablecoins have a trading volume of 35 trillion a year, how much of it is real payment?

Galaxy Research: AI agents are giving rise to new species on the blockchain, how zero-human companies activate the financial flywheel

Data Research: How big is the liquidity gap between Hyperliquid and CME crude oil?

Why Are GPU Prices Skyrocketing Out of Control?

How to Master Claude Cowork Completely?

70-Page Confidential Letter Alleges First Charge of 'Lying,' Altman Tells Board 'I Can't Change My Personality'
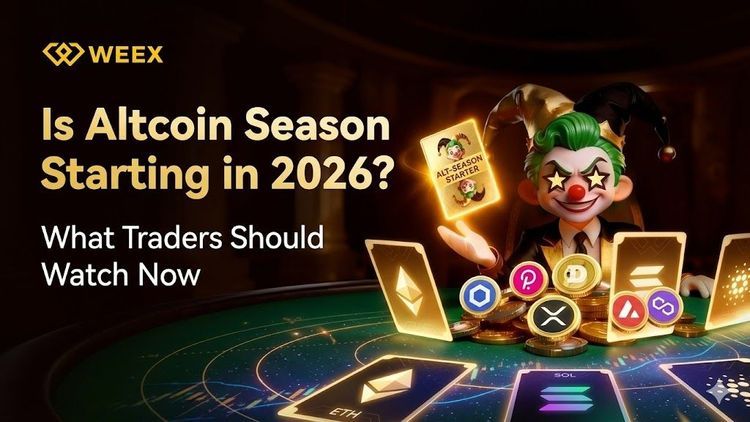
Is Altcoin Season Starting in 2026? What Traders Should Watch Now
Altcoin season signals are becoming clearer in 2026 as capital rotation across crypto markets accelerates. Here’s what traders should watch and how strategy-based participation is evolving in the current market cycle.
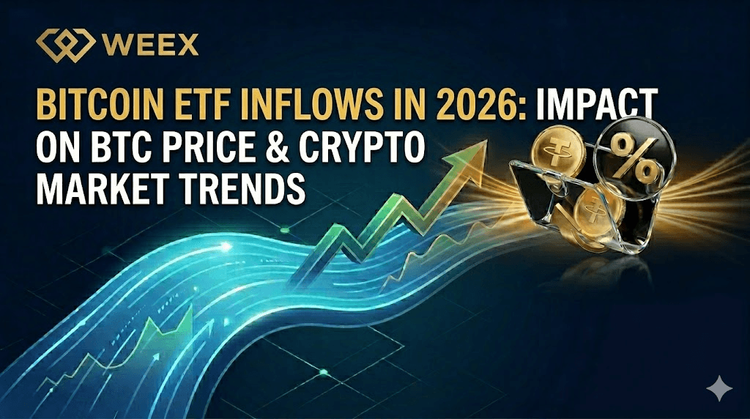
Bitcoin ETF Inflows in 2026: Impact on BTC Price and Crypto Market Trends
Bitcoin ETF inflows are reshaping BTC price trends and crypto market liquidity in 2026. See how institutional capital is influencing volatility, trading behavior, and portfolio allocation strategies across crypto markets.
Visa's Stablecoin Strategy: Cards, Settlement, and the Future

Stock Market Split

How to capture the next Alpha in the narrative of predictive markets?

"Legal" Ponzi scheme? Unveiling the circular lending of Gemini exchange and its founder

The first stock of stablecoins, Circle, has officially launched the new public chain ARC points system, and the interactive guide is here

Oil prices are approaching a critical point. What will happen in mid-April?
The oil price is approaching a critical point, what will happen in mid-April?

Mechanism drives value, deflation leads the future: MIAU will officially launch on PancakeSwap on April 13
