BTC Price Today: Will Bitcoin Hold $58,000 or Break Lower?


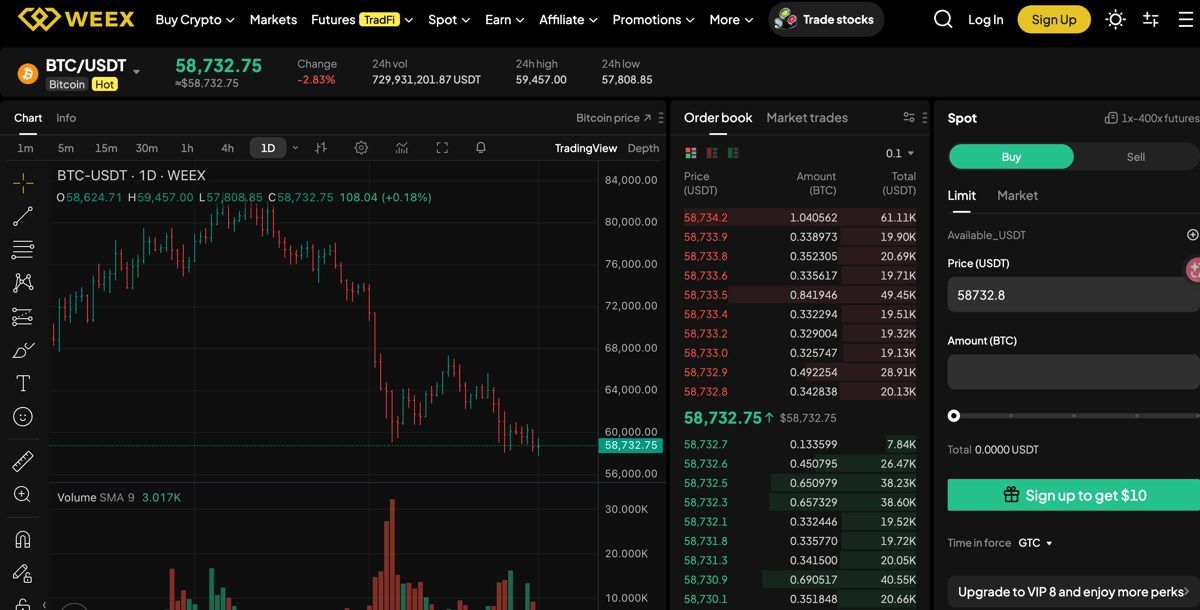
Bitcoin is trading near $58,732.75 on the BTC/USDT spot market after a 2.83% 24-hour decline. The latest WEEX market view shows 24-hour volume around 729,931,201.87 USDT, with BTC moving between a low of $57,808.85 and a high of $59,457.00.
The short-term setup is defensive. BTC is hovering above the $58,000 support area, but the daily chart still shows sellers controlling the broader move after a sharp decline from higher levels. Users who want to follow Bitcoin markets directly can create a WEEX account and monitor the BTC/USDT spot market as price tests the next support zone.
BTC Price Snapshot: Support and Resistance Near $58,000
| Item | Current read | Why it matters |
|---|---|---|
| Spot price | $58,732.75 | BTC is trading just above the key $58,000 support area |
| 24h change | -2.83% | Shows strong short-term selling pressure |
| Support zone | $57,808.85 to $58,000 | First area buyers need to defend |
| Resistance zone | $59,457 to $60,000 | First area buyers need to reclaim cleanly |
| Market bias | Bearish with possible short-term range behavior | BTC needs a reclaim of $60,000 to improve momentum |
| Next key level | $60,000 / $57,800 | Upside and downside levels to watch next |
Why Is Bitcoin Price Falling Today?
BTC price is being shaped by renewed selling pressure, weak follow-through above $60,000, and a test of the lower side of the recent range. The 2.83% decline shows that sellers are still active, even though Bitcoin remains above the 24-hour low.
The daily chart also keeps the setup cautious. BTC has been moving lower from the $80,000 area shown on the chart, then failed to build a lasting recovery above the mid-range. That makes the $57,808.85 to $58,000 area the first major line for bulls to defend.
BTC Price Forecast: Can Bitcoin Reclaim $60,000?
A recovery path for BTC starts with holding the $57,808.85 to $58,000 support band. If buyers defend that zone and push Bitcoin back above $59,457, the next test would be around $60,000. A stronger move through $60,000 could bring $61,500 and $62,500 back into focus.
For now, the recovery case needs confirmation. BTC needs sustained buying above $60,000, not only a brief bounce from support. Traders should watch whether price can form higher lows and whether volume improves during any push above resistance.
What Happens If BTC Loses $58,000 Support?
The bearish case becomes stronger if Bitcoin loses the $57,808.85 support level. A clean break below that area would suggest that the current support test failed and could expose lower liquidity zones.
If $57,800 breaks, traders may start watching $56,000 first, followed by $55,000 as a larger downside area. Another drop could also develop if BTC repeatedly fails near $59,457 to $60,000, because failed resistance tests often invite more short-term selling.
Bitcoin Support and Resistance Levels to Watch
| Level | BTC price zone | Why it matters |
|---|---|---|
| Immediate support | $57,808.85 to $58,000 | Recent low area and first zone buyers need to defend |
| Near-term resistance | $59,457 to $60,000 | Recent 24-hour high and major psychological resistance |
| Bullish extension | $61,500 to $62,500 | Potential upside area if BTC reclaims $60,000 with volume |
| Breakdown watch | Below $57,808.85 | Would weaken the range and confirm renewed selling pressure |
BTC Market Data: Volume, Highs, and Lows
| Metric | Current reading | Trader focus |
|---|---|---|
| Spot price | $58,732.75 | Whether BTC can hold above $58,000 |
| 24h change | -2.83% | Shows strong short-term selling pressure |
| 24h high | $59,457.00 | First level buyers need to reclaim |
| 24h low | $57,808.85 | Key support for the current move |
| 24h volume | 729,931,201.87 USDT | Watch whether volume rises during a breakdown or recovery attempt |
BTC Technical Analysis: Momentum and Volume
| Indicator | Current read | What traders should watch |
|---|---|---|
| MACD | Not confirmed from the screenshot | Watch for momentum improvement before trusting a larger recovery |
| RSI | Not confirmed from the screenshot | Check whether BTC is stabilizing or still weakening near support |
| Major support | $57,808.85 to $58,000 | Loss of this zone would favor sellers |
| Major resistance | $59,457 to $60,000 | Break above this zone would improve the short-term setup |
Bitcoin Trading Scenarios: Rebound or Breakdown?
| Scenario | Trigger | Possible BTC reaction |
|---|---|---|
| Bullish rebound | BTC holds $58,000 and reclaims $60,000 | Price may retest $61,500 to $62,500 if volume supports the move |
| Range-bound trade | BTC stays between $57,808.85 and $60,000 | Short-term traders may focus on support and resistance reactions |
| Bearish breakdown | BTC loses $57,808.85 | Price could test $56,000 or $55,000 as sellers regain control |
What This Means for BTC Traders
BTC is under pressure, and the $58,000 area is the immediate decision point. Spot traders may prefer waiting for a clean reclaim of $60,000 before treating the move as a recovery, or watching for a stronger reaction near $57,800 before considering dip entries.
Risk control matters because Bitcoin can move sharply around major psychological levels. Traders should avoid chasing one candle, watch order execution around $58,000 and $60,000, and size positions according to the risk of a break below support.
How to Trade Bitcoin on WEEX: Step by Step Guide
- Step 1: Go to the WEEX official website and create your WEEX account.
- Step 2: Deposit funds by transferring crypto from your wallet or buying through WEEX Quick Buy.
- Step 3: Go to the spot section and search for the BTC/USDT trading pair.
- Step 4: Enter the amount of BTC you want to buy or sell and place your order.
- Step 5: Secure your Bitcoin. You can move BTC to your own wallet or keep it on WEEX only for active trading.
Bottom Line
Bitcoin is bearish in the short term while it trades below the $59,457 to $60,000 resistance zone. BTC still has a chance to stabilize if buyers defend $57,808.85 to $58,000, but a clean break below that area would increase downside risk. A move back above $60,000 would be the first sign that buyers are regaining control.
Before you go: you can learn about the WEEX Token (WXT) for ecosystem participation, and new users may explore the WEEX welcome bonus with limited-time rewards such as trading coupons and task-based incentives.
FAQ
1. What is Bitcoin price today?
Bitcoin is trading near $58,732.75 on the BTC/USDT spot market, based on the latest WEEX market view in the screenshot.
2. Is BTC bullish or bearish right now?
BTC looks bearish in the short term because price is down 2.83% over 24 hours and remains below the $59,457 to $60,000 resistance zone.
3. What is the key support level for Bitcoin?
The main short-term support area is around $57,808.85 to $58,000. A break below that zone would weaken the current setup.
4. What resistance should BTC traders watch?
BTC traders should watch $59,457 first, followed by $60,000. A stronger move above $60,000 could improve the recovery setup.
5. Can Bitcoin recover from here?
Bitcoin can recover if buyers defend the $58,000 area and push price above $60,000 with stronger volume. Without that confirmation, the rebound risk remains limited.
6. Can I trade BTC on WEEX?
Yes. BTC/USDT is available as a spot market on WEEX, allowing users to buy and sell Bitcoin against USDT.
7. What should beginners watch before trading BTC?
Beginners should watch price support, resistance, volume, spread, liquidity, and broader market sentiment before entering a trade.
DISCLAIMER: WEEX and affiliates provide digital asset exchange services, including derivatives and margin trading, only where legal and for eligible users. All content is general information, not financial advice-seek independent advice before trading. Cryptocurrency trading is high risk and may result in total loss. By using WEEX services you accept all related risks and terms. Never invest more than you can afford to lose. See our Terms of Use and Risk Disclosure for details.
You may also like

What is ANSEM(ANSEMSOL) Coin? Everything you need to know, how to buy, and when is the best time to trade ANSEMSOL/USDT
ANSEM (ticker: ANSEMSOL) is a newly listed Solana memecoin now tradable on WEEX; the ANSEMSOL/USDT pair opened for…
Buy or Sell MU Stock Now? Micron Forecast 2026–2027 AI Memory Boom
Micron Technology’s “MU” sits at the heart of the AI memory boom, with HBM and advanced DRAM anchoring…
Can MU Reach $1500 in 2026? Micron Technology Price Prediction
KEY TAKEAWAYS MU is currently priced at $1,150 against USDT. Reaching $1,500 implies an upside of approximately 30.4%…
Should I Sell MU Stock Now or Hold? Micron Forecast 2026–2027
MU sits at the crossroads of the AI memory supercycle and the next leg of data center buildouts.…
What is Strategy Stretch Preferred Corporation(STRCON) Coin? A comprehensive guide you shouldn’t miss
Strategy Stretch Preferred Corporation (STRCON) is the Ondo tokenized version of the Strategy Stretch Preferred (STRC), a perpetual…
What is Gensyn(AI) Coin: Everything You Need to Know and How to Buy AI/USDT
This guide explains what Gensyn (ticker: AI) is, how the network works, how the token is used, where…
Can SKHYNIX Drop to $1500 in 2026? SK hynix Price Outlook
KEY TAKEAWAYS Current price: SKHYNIX/USDT futures are at 1645.84, based on live exchange data at publication time. Required…
Can STRCON Reach $100 in 2026? Strategy Stretch Preferred Corporation Price Prediction
KEY TAKEAWAYS Current price: STRCON trades near $87.08 today, based on major market trackers and exchange order books.…
Can AI Reach $0.1 in 2026? AI Price Prediction
KEY TAKEAWAYS AI trades around $0.034 at publication time, based on major market aggregators. To reach $0.1 by…
Can NKE Reach $50 in 2026? Nike Price Prediction
KEY TAKEAWAYS Current price: NKE futures trade around $39 per contract at the time of writing. Required upside:…
Can ETH Drop to $1000 in 2026? ETH Price Outlook
KEY TAKEAWAYS Current price: ETH is trading around $1,575. Required move: Hitting $1,000 implies a decline of about…
Can SOXL Reach $300 in 2026? Direxion Daily Semiconductor Bull 3X ETF Price Prediction
KEY TAKEAWAYS Current price: SOXL trades around $259 at publication time. Required move: A climb of about 15.8%…
Can BTC Drop to $50000 in 2026? BTC Price Outlook
KEY TAKEAWAYS BTC trades around $58,738 today, based on major market dashboards tracking real-time spot prices. Hitting the…
SK hynix (SKHYNIX) Price Prediction, Forecast for July 2026: Will SKHYNIX/USDT Pull Back Toward 1500?
At publication, SKHYNIX/USDT is trading at 1,645.84 per contract on WEEX. Liquidity and prints come directly from the…
Strategy Stretch Preferred Corporation (STRCON) Price Prediction July 2026: Forecast Toward $100 Par
Strategy Stretch Preferred Corporation (STRCON) is trading near $87.08 today, according to live pricing compiled by CoinMarketCap and…
Gensyn (AI) Price Prediction July 2026: Forecast, Key Levels, and a Possible Path Toward $0.10
Gensyn (AI) is drawing fresh attention as decentralized AI compute markets heat up. As of publication, the WEEX…
Nike Stock Price Prediction 2026–2030: Can NKE Recover to $100?
Nike stock is trading around $40, getting to $100 by 2030 means roughly 150% appreciation over four years. The brand is intact, the valuation is historically cheap, and the turnaround is underway. This guide examines what the path to $100 actually requires and what could keep Nike stock well short of it.
Nike Stock Is Down 75% From Its All Time High: Is Now the Time to Buy?
Nike stock is trading around $40, down roughly 75% from its all time high near $180 in late 2021. The brand is intact, the valuation is the cheapest it has been since 2008, and analysts see roughly 40% upside from current levels. This guide examines whether the case for buying is actually as straightforward as those numbers suggest.
What is ANSEM(ANSEMSOL) Coin? Everything you need to know, how to buy, and when is the best time to trade ANSEMSOL/USDT
ANSEM (ticker: ANSEMSOL) is a newly listed Solana memecoin now tradable on WEEX; the ANSEMSOL/USDT pair opened for…
Buy or Sell MU Stock Now? Micron Forecast 2026–2027 AI Memory Boom
Micron Technology’s “MU” sits at the heart of the AI memory boom, with HBM and advanced DRAM anchoring…
Can MU Reach $1500 in 2026? Micron Technology Price Prediction
KEY TAKEAWAYS MU is currently priced at $1,150 against USDT. Reaching $1,500 implies an upside of approximately 30.4%…
Should I Sell MU Stock Now or Hold? Micron Forecast 2026–2027
MU sits at the crossroads of the AI memory supercycle and the next leg of data center buildouts.…
What is Strategy Stretch Preferred Corporation(STRCON) Coin? A comprehensive guide you shouldn’t miss
Strategy Stretch Preferred Corporation (STRCON) is the Ondo tokenized version of the Strategy Stretch Preferred (STRC), a perpetual…
What is Gensyn(AI) Coin: Everything You Need to Know and How to Buy AI/USDT
This guide explains what Gensyn (ticker: AI) is, how the network works, how the token is used, where…