
Texas Instruments Stock Price Prediction 2026: Can TXN Deliver More Upside?



Texas Instruments (TXN) has delivered a remarkable 68% year-to-date return as of July 2026, powered by a 19% revenue surge in Q1 and a long-awaited free cash flow inflection as its massive capacity buildout winds down. The semiconductor giant reported Q1 2026 revenue of $4.83 billion, up 19% year-over-year, driven by industrial growth exceeding 30% and data center revenue soaring 90% year-over-year . With the CapEx peak now behind them, investors analyzing TXN stock price prediction models are asking whether the rally can continue through 2027.
The company completed a six-year, $20+ billion capacity buildout across new fab sites in Sherman, Texas, and a retooled facility in Lehi, Utah. CapEx is now guided to $2-3 billion for 2026, down sharply from prior years, while trailing 12-month free cash flow rose to $4.4 billion at Q1 end, up from $1.7 billion a year earlier . CEO Haviv Ilan stated on the Q1 earnings call that reaching $8 free cash flow per share for 2026 is "very likely" . This analysis examines the fundamentals, analyst consensus, and key factors shaping TXN stock performance.
Key Takeaways
- Q1 2026 revenue hit $4.83 billion, up 19% year-over-year, with industrial up 30%+ and data center up 90% .
- Analyst ratings show 15 buys, 17 holds, and 3 sells with a mean target of $298, roughly matching the current price .
- Management expects free cash flow per share to reach approximately $8 for 2026 as CapEx declines .
- TIKR's mid-case model values TXN at $522 by December 2030, implying 75% total return or 13% annualized .
- Data center revenue reached 12% of total revenue in Q1, up from 9% a year ago, with the addressable market growing from $7.5B to $12.5B in 2026 .
TXN Stock Q1 2026 Earnings: The Inflection Point
Revenue Growth Across All Segments
Texas Instruments reported Q1 2026 revenue of $4.83 billion, beating the top of its guided range and marking the strongest top-line growth in several years . The growth came from multiple directions simultaneously:
- Industrial: Grew more than 30% year-over-year and more than 20% sequentially, with expansion across all sectors and geographies .
- Data Center: Grew 90% year-over-year and more than 25% sequentially, reaching 12% of total revenue, up from 9% a year ago .
- Embedded Processing: Continued recovery alongside analog, fueled by industrial and automotive demand .
Free Cash Flow Inflection
The most important signal is what the growth reveals about the investment cycle. Texas Instruments completed a six-year capacity buildout, and CapEx is now guided to $2-3 billion for 2026, down sharply from prior years . Depreciation is guided at $2.2-2.4 billion.
Free cash flow trajectory:
- Q1 2026 FCF per share: $0.84 (actual)
- Q2 2026 consensus estimate: $1.92 (254% year-over-year increase)
- Full-year 2026: Management targets ~$8 per share
The FCF margin forecast of 43% in Q4 2026 represents the clearest expression of what the CapEx rolloff does to the cash model at scale .
What Analyst Say About TXN Stock
Ratings and Price Targets Are Split
As of June 2026, analysts covering Texas Instruments stock present a divided outlook:
- 26-39 analysts cover TXN with ratings distributed across buy, hold, and sell
- Consensus rating: Moderate Buy / Hold (varies by source)
- Mean price target: $294-298, roughly matching the current stock price
- High target: $400, Low target: $200
Recent analyst actions include:
- Bank of America raised target to $370 with a Buy rating
- Seaport Global upgraded to Buy with a $400 target
- Stifel Nicolaus maintains a Buy rating with a $340 target
- Citi reiterated Buy with a $345 target
The mean target-to-price ratio has compressed from 114% a year ago to 100% today, meaning TXN stock has essentially repriced to where the median analyst thought it would be .
Can Texas Instruments Stock Deliver More Upside?
Bull Case: Why TXN Could Continue Rising
Several factors support continued upside for TXN stock:
- CapEx rolloff: The massive investment cycle is complete, allowing free cash flow to accelerate .
- Data center growth: The analog and embedded data center addressable market is growing from $7.5B to $12.5B in 2026, with TI holding roughly 20% market share .
- Industrial recovery: The largest segment grew 30%+ year-over-year and shows no signs of slowing .
- CHIPS Act funding: $630M received to date toward up to $1.6B, providing additional cash flow support .
- Dividend yield: 3.11% with a history of dividend growth .
Bear Case: Risks to Consider
- Valuation: P/E ratio of approximately 54.7, suggesting the stock may be overvalued relative to earnings .
- Elevated leverage: Total debt near $14B with a weighted average coupon of ~4% .
- High inventory days: 209 days of inventory ties significant cash and signals demand uncertainty .
- Acquisition risk: The Silicon Labs acquisition introduces integration complexity and near-term charges .
- Insider selling: Notable executive share sales have been reported .
Long-Term Forecast: TIKR's $522 Target
TIKR's mid-case model values Texas Instruments at $522 by December 2030, implying 75% total return from the current price, or 13% annualized over 4.5 years . The model does not require a new catalyst to get there—the CapEx cycle is over, utilization is rising, and data center revenue is compounding from a 12% base .
How to Trade TXN Stock on WEEX: Step by Step Guide
Here is the full guide to buying TXN stock on WEEX:
- Step 1: Go to WEEX official website and register with your email or phone number.
- Step 2: Transfer USDT to your WEEX account or buy directly via fiat or quick buy. Choose any network — ERC-20, TRC-20, BEP-20 — all are supported.
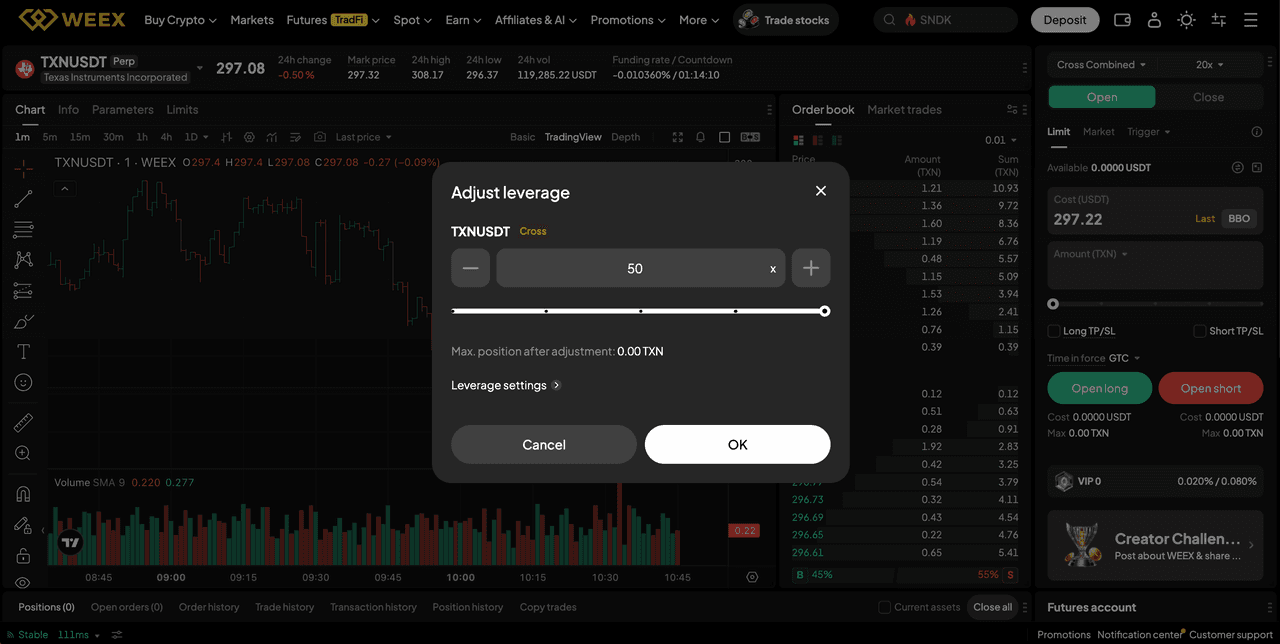
- Step 3: Go to the WEEX Futures page and search for TXNUSDT.
- Step 4: Adjust leverage from 1x to 50x. You can access up to 50x leverage on TXN.
- Step 5: Choose Long or Short.
- Step 6: Set Stop Loss or Take Profit. Then place your order.
Conclusion: Should You Invest in TXN Stock?
The decision to invest in TXN stock depends on your investment horizon and risk tolerance. For long-term investors, the company's structural position in analog and embedded semiconductors, combined with a recovering free cash flow profile, makes it an attractive candidate for portfolios seeking exposure to the semiconductor sector.
For short-term traders, the Q2 2026 earnings report on July 22 will be a critical catalyst . If results confirm FCF above $1.92 per share, consensus estimates will need to move higher, potentially driving the stock price upward.
Ready to trade? Sign up on WEEX Now and Start Trading!
FAQ
1. What is the Texas Instruments stock price prediction for 2026?
Analysts have a mean 12-month price target of approximately $294-298, roughly matching the current price. The high target is $400, and the low target is $200.
2. Is Texas Instruments stock a buy, hold, or sell?
Analyst ratings are split: approximately 15 buys, 17 holds, and 3 sells, with a consensus rating of Moderate Buy to Hold depending on the source.
3. What is Texas Instruments' free cash flow forecast for 2026?
Management expects free cash flow per share to reach approximately $8 for full-year 2026, up from $0.84 in Q1 2026, driven by lower CapEx and higher revenue.
4. When is Texas Instruments' next earnings report?
Texas Instruments will report Q2 2026 earnings on July 22, 2026, with consensus estimates of $1.92 EPS.
5. What is driving Texas Instruments' recent stock performance?
The stock is up 68% year-to-date driven by Q1 revenue growth of 19% year-over-year, strong industrial and data center demand, and a free cash flow inflection as the company's massive capacity buildout winds down.
Disclaimer: This content is provided for general informational and educational purposes only and should not be considered financial, investment, legal, or tax advice. Nothing in this article constitutes an offer, recommendation, solicitation, or invitation to buy, sell, or trade any crypto asset or use any specific service. Crypto assets are highly volatile and involve a high degree of risk. You may lose some or all of the value of your investment and should not invest funds you cannot afford to lose.WEEX services may not be available in all regions and are subject to applicable laws, regulations, and user eligibility requirements. Please carefully assess risks and confirm local requirements before making any financial decisions.