Bitcoin Falls Toward $70K: ETF Outflows, Liquidations and What Happens Next

 Prefer us on Google

Introduction
The Bitcoin price drop in November 2026 accelerated on November 12 as BTC fell below $72,000 and approached the psychologically important $70,000 level. The decline followed several sessions of pressure across cryptocurrency and technology markets, with U.S. spot Bitcoin ETFs recording substantial net withdrawals and leveraged long positions facing forced liquidation. Some market reports subsequently recorded BTC trading below $70,000, highlighting how quickly selling pressure can intensify once widely watched price levels fail.
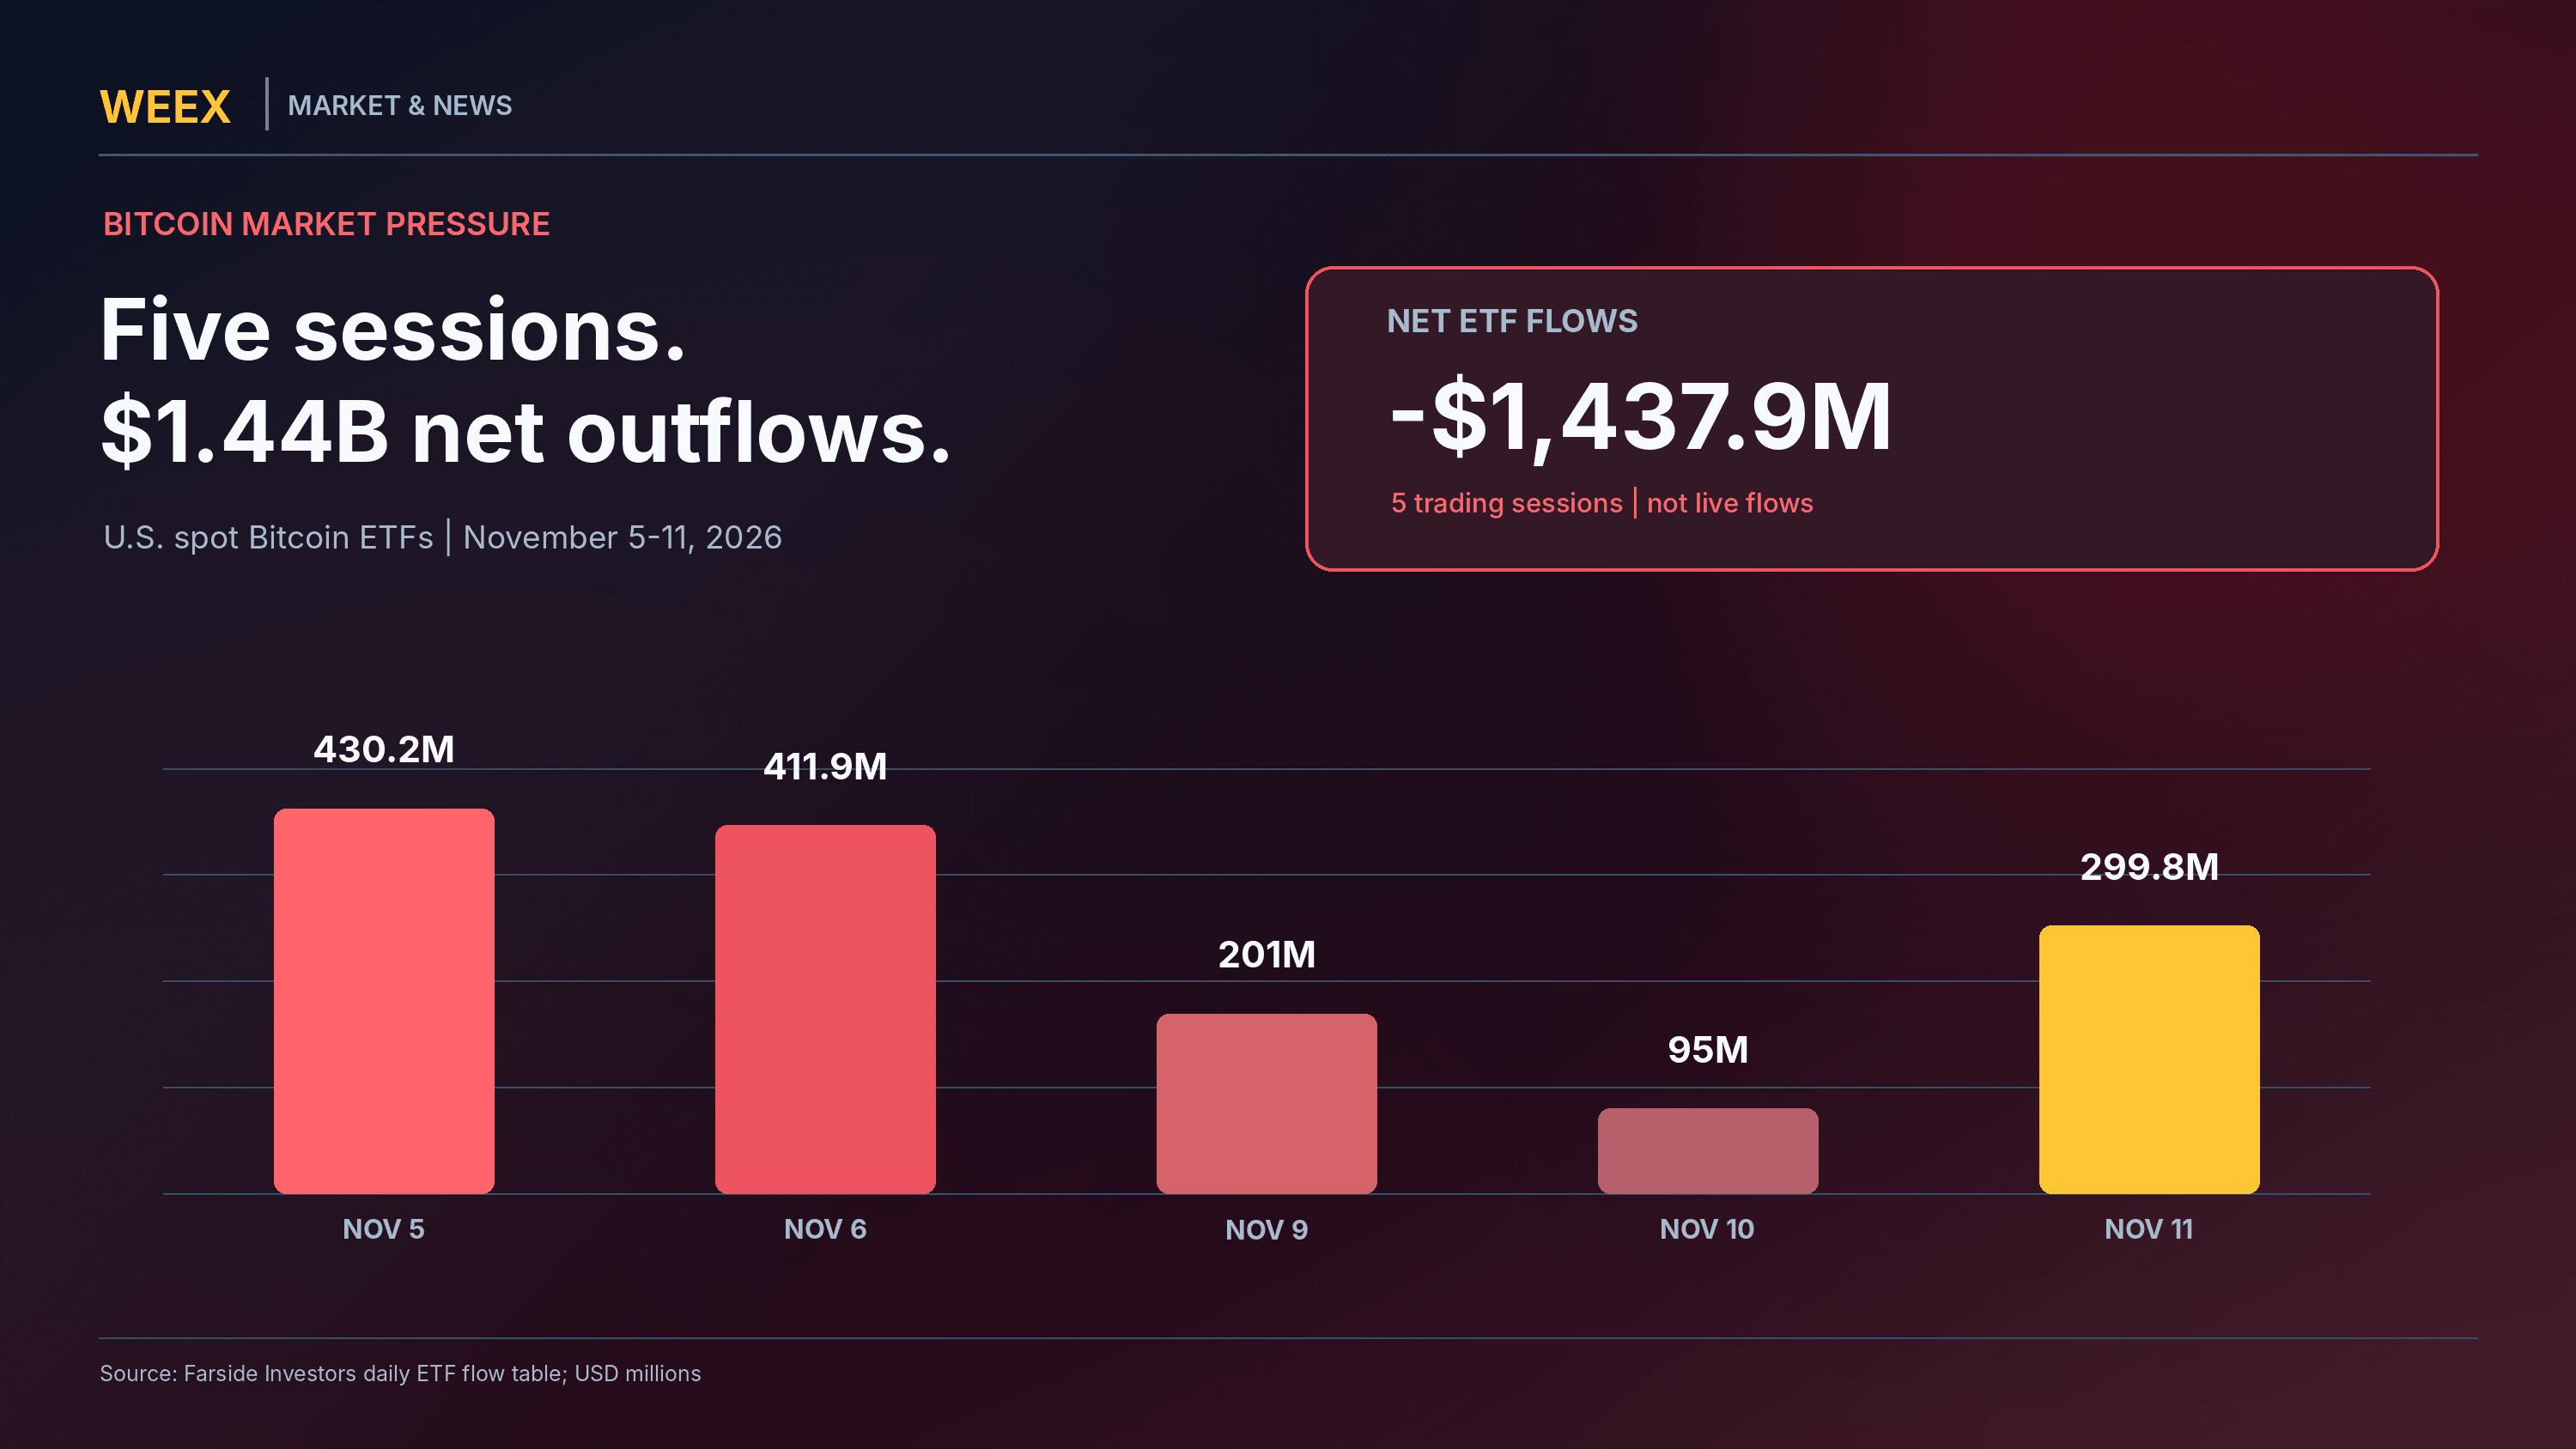
The Bitcoin price drop in November 2026 reflects more than a single negative headline. According to Farside Investors, U.S. spot Bitcoin ETFs recorded approximately $1.44 billion in combined net outflows over the five trading sessions from November 5 through November 11. Meanwhile, market reports on November 12 described more than $650 million in cryptocurrency derivatives liquidations during a 24-hour period, with bullish positions accounting for most of the forced closures. ETF withdrawals and leveraged liquidations operate through different market mechanisms, but both can contribute to a period of weak demand and heightened volatility.
For investors analyzing the Bitcoin price drop in November 2026, the key question is whether the $70,000 area represents a sustainable support zone or simply another temporary pause in a broader market decline. Price levels alone cannot answer that question. More useful evidence includes ETF flows, spot-market demand, futures open interest, funding conditions, and whether buyers are willing to absorb selling without relying on additional leverage. This article examines the data behind the selloff, explains how forced liquidations amplify price moves, and outlines the indicators that could help distinguish a recovery from continued weakness.
Why Is Bitcoin Falling Toward $70,000?
Bitcoin's November decline has coincided with a broader reduction in investors' appetite for risk. Technology stocks have faced selling pressure, while cryptocurrency markets have experienced renewed concerns about macroeconomic conditions, regulatory developments, and the sustainability of institutional inflows.
These factors do not operate independently. When investors become less willing to hold volatile assets, demand may weaken simultaneously for growth equities, cryptocurrency exchange-traded funds, and leveraged digital asset positions. Bitcoin can therefore decline even without a specific technical failure or negative change to its underlying network.
The most directly measurable pressures in the current selloff are ETF withdrawals and derivatives liquidations. ETF flows reveal net changes in investment-product exposure, while liquidation figures show how leveraged trading positions are being closed as market prices move against them. The combination can create a difficult environment for price stabilization, particularly when new spot demand is insufficient to absorb selling.
Bitcoin November 2026 Selloff: Key Market Data
| Indicator | Reported Observation | Period / Source |
|---|---|---|
| Bitcoin Price | Below $72,000 | November 12 market reports |
| Closely Watched Level | $70,000 | Psychological price threshold |
| Spot BTC ETF Net Outflows | Approximately $1.44B | November 5–11, Farside |
| November 11 Spot BTC ETF Outflows | $299.8M | Farside Investors |
| BlackRock IBIT Outflows | $269.7M | November 11, Farside |
| Reported Crypto Derivatives Liquidations | More than $650M | November 12, selected 24-hour snapshot |
| Main Liquidation Exposure | Leveraged long positions | CoinGlass data cited by market reporting |
| Broader Market Context | Weakness in technology equities | November 12 market coverage |
Sources: Farside Investors — U.S. Bitcoin ETF Flows, CoinDesk — November 12 Market Update, and Bitcoin.com — November 12 Liquidation Report. Prices and liquidation totals are time-specific observations, not live quotations.
The figures show two distinct forms of pressure. ETF outflows have accumulated across multiple sessions, suggesting that demand from a significant group of investment vehicles has weakened. Derivatives liquidations, by contrast, can intensify over minutes or hours when prices reach levels that trigger automatic position closures.
Neither metric independently proves that Bitcoin will continue falling. However, their combination helps explain why a decline that begins gradually can develop into a faster and more volatile market move.
How Much Money Has Left U.S. Spot Bitcoin ETFs?
U.S. spot Bitcoin ETFs allow investors to obtain Bitcoin exposure through regulated exchange-traded investment products. Their daily net flows are therefore closely watched as one indicator of demand from investors using traditional brokerage accounts and institutional investment structures.
Farside Investors reported negative combined flows on several consecutive trading days in early November. Between November 5 and November 11, the funds recorded approximately $1.44 billion in net withdrawals, with particularly large outflows on November 5 and 6.
U.S. Spot Bitcoin ETF Net Flows
| Trading Date | Net Flow | Interpretation |
|---|---|---|
| November 5, 2026 | -$430.2M | Significant daily outflow |
| November 6, 2026 | -$411.9M | Selling pressure continued |
| November 9, 2026 | -$201.0M | Further net withdrawals |
| November 10, 2026 | -$95.0M | Smaller but still negative flow |
| November 11, 2026 | -$299.8M | Renewed acceleration |
| Five-Session Total | -$1,437.9M | Approximately $1.44B |
Source: Farside Investors — Historical Bitcoin ETF Daily Flows. Figures are net flows in U.S. dollars and may be subject to subsequent revisions.
The five-session total is large enough to merit attention, but it should not be interpreted as a direct one-to-one measurement of Bitcoin sold into the open market at the exact same moment. ETF creations and redemptions involve authorized participants, fund holdings, and operational processes that can produce differences in transaction timing.
An ETF outflow also does not mean that all investors have abandoned Bitcoin. It measures the net movement for the specified group of products during the observation period. Other market participants may be buying BTC directly, holding existing positions, or trading through different vehicles.
The stronger conclusion is that one important source of demand was negative during the period. To determine whether the selling pressure is easing, investors should watch whether future ETF flow figures stabilize or return to positive territory.
Why Do Repeated ETF Outflows Matter More Than One Negative Day?
One day of outflows can result from routine portfolio adjustments, profit-taking, or a temporary change in risk appetite. Several consecutive negative sessions suggest a more persistent reduction in net exposure.
The distinction matters because Bitcoin's ability to recover depends partly on the balance between available supply and incremental demand. If investors continue redeeming ETF shares while other buyers remain cautious, the market may struggle to sustain a rebound.
However, repeated outflows do not establish that a fixed quantity of Bitcoin will be sold indefinitely. Flow trends can reverse, and their significance depends on the broader market environment.
For readers monitoring institutional cryptocurrency investment products, the WEEX Crypto ETF Tracker provides an overview of supported ETF-related market information.
-- Price
How Did Leverage Turn Bitcoin's Decline Into a Liquidation Wave?
Perpetual futures allow traders to hold positions larger than their initial margin through leverage. While leverage increases potential returns, it also magnifies losses relative to the capital committed.
When the market moves against a leveraged long position, the trader's available margin declines. If the position reaches the exchange's liquidation threshold, the trading platform may automatically close it to satisfy its risk-management requirements.
These forced closures can add selling activity during a market decline. If sufficient positions are concentrated around similar liquidation levels, an initial fall may trigger additional liquidations, creating a feedback loop.
Market reports on November 12 described more than $650 million in crypto derivatives liquidations during a 24-hour period, with most of the reported losses associated with bullish positions. Exact totals vary across providers and observation windows, so they should be treated as dated estimates rather than a single permanent market statistic.
How a 5% Bitcoin Decline Affects Different Leverage Levels
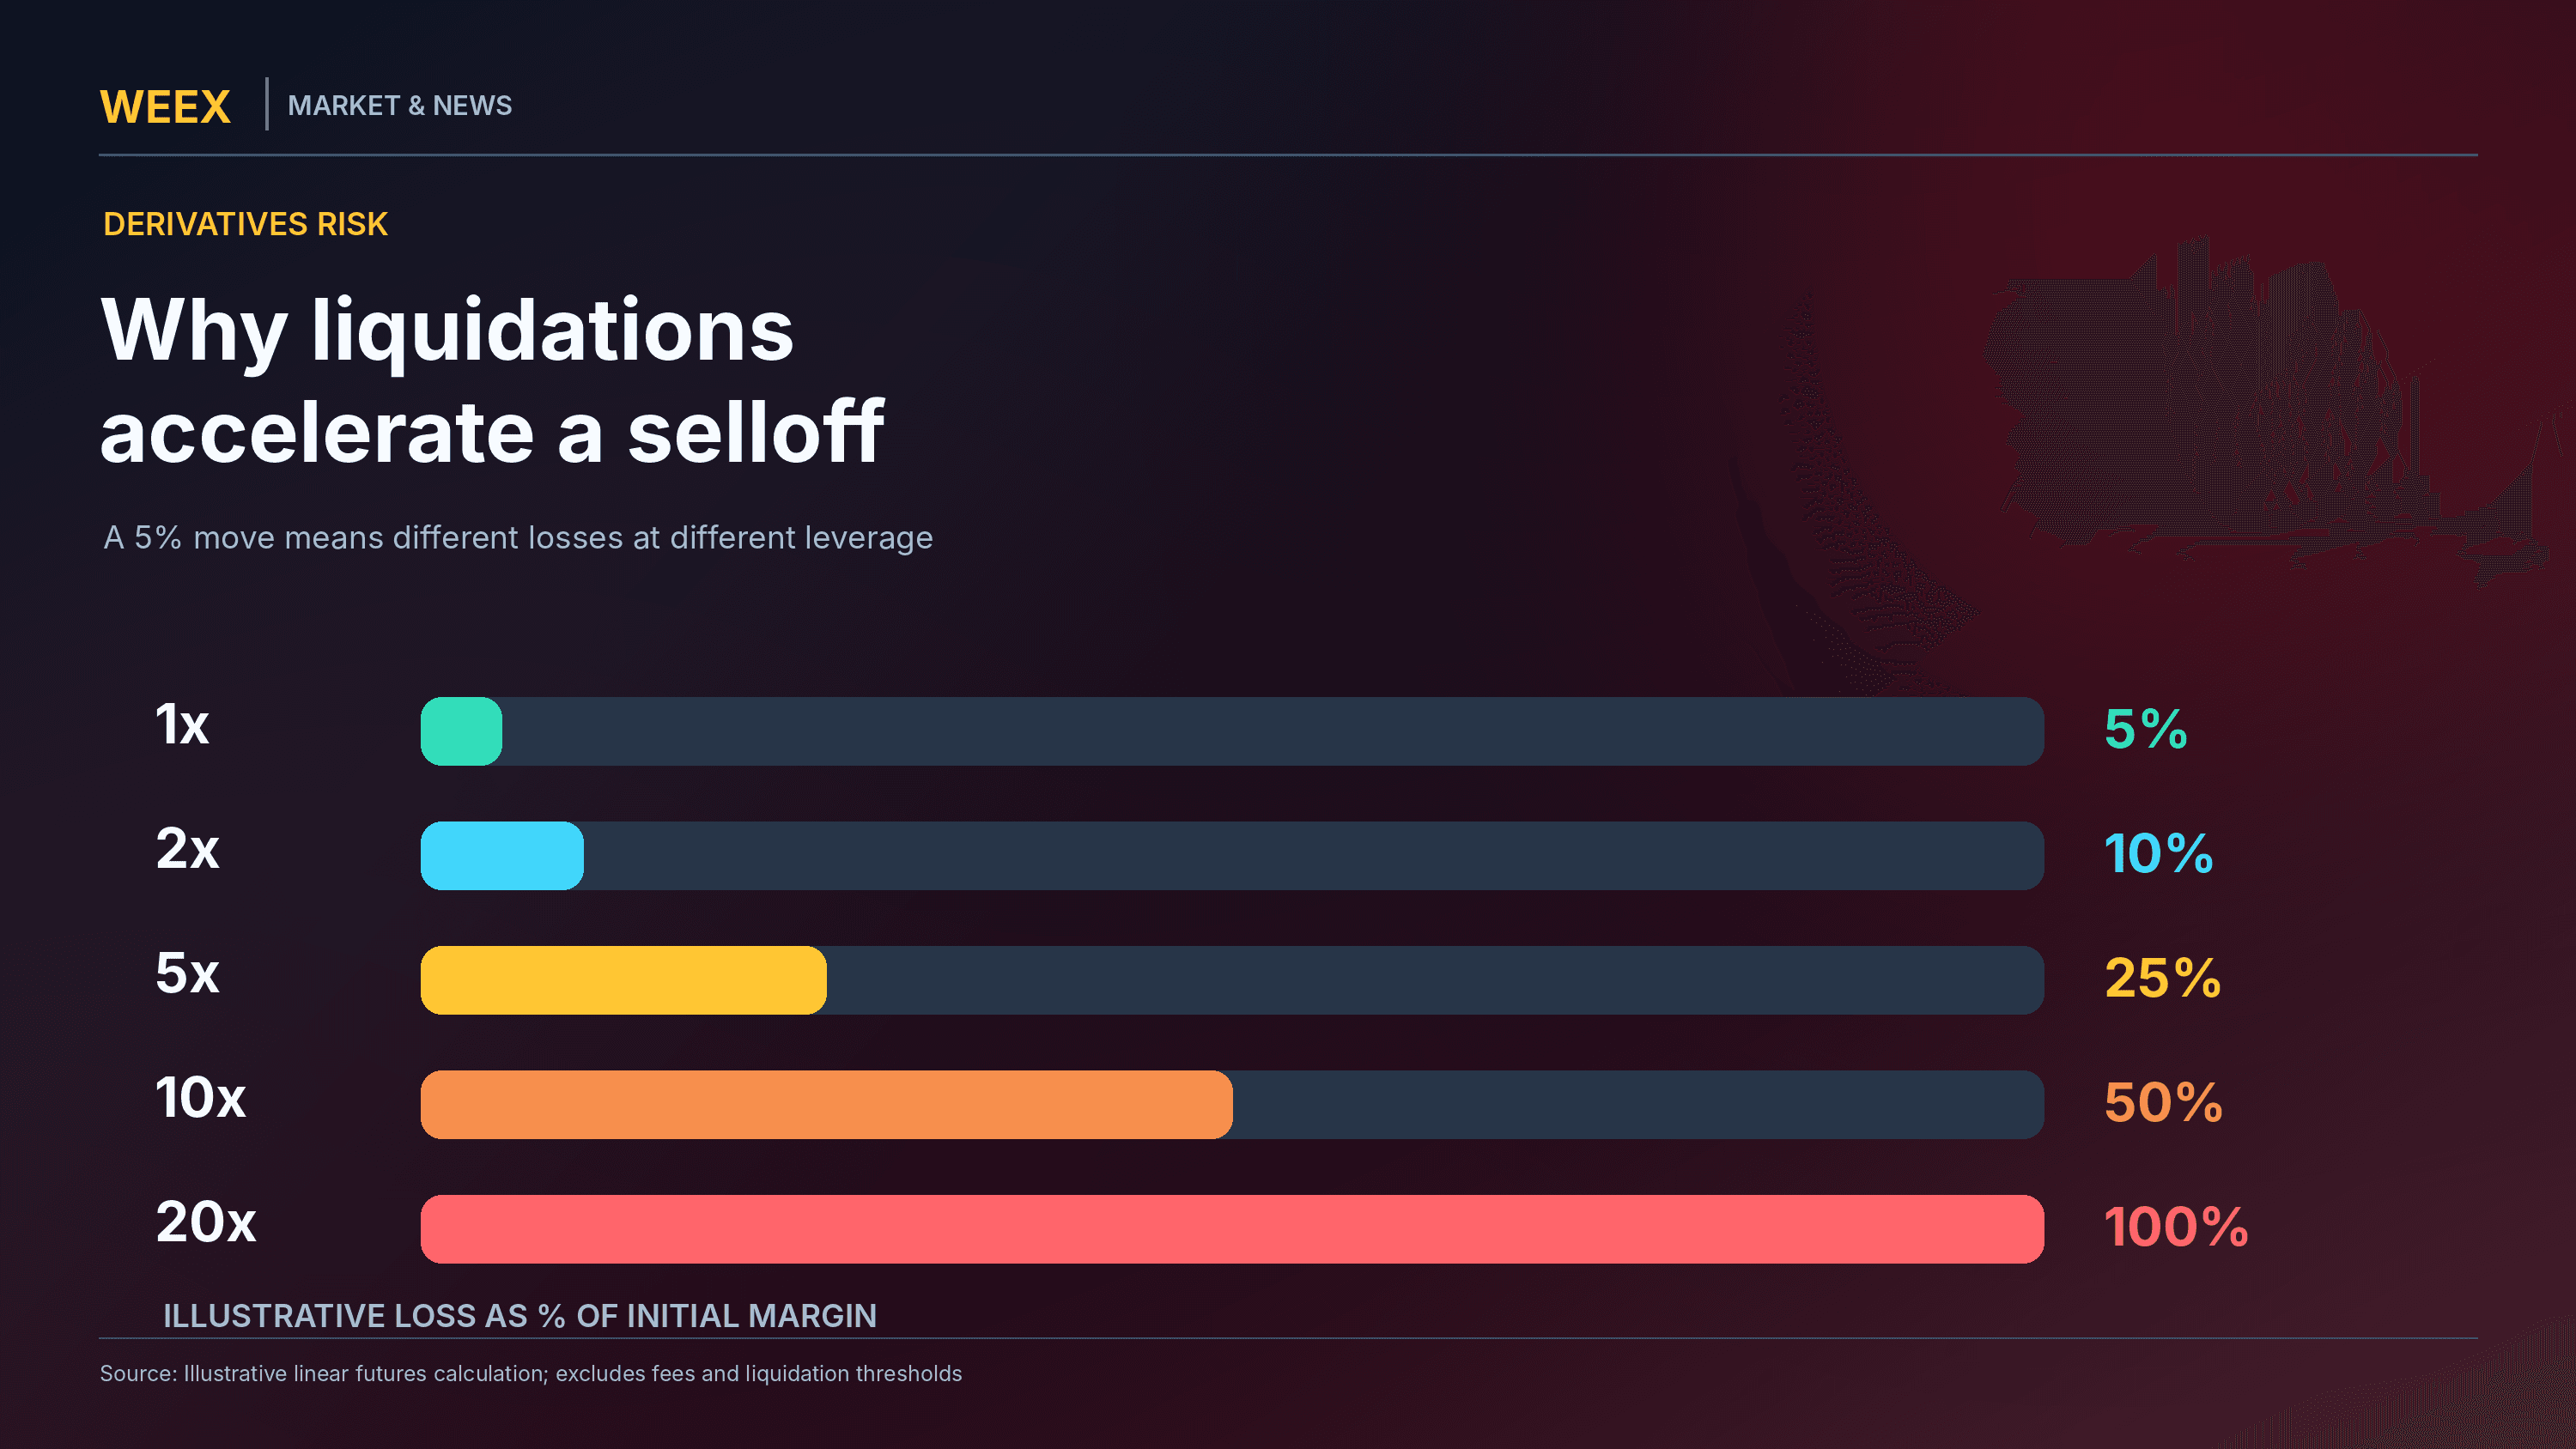
Consider a simplified futures position with $1,000 in initial margin. The following calculations assume linear price exposure, with no fees, funding payments, additional collateral, or liquidation occurring before the illustrated price change.
| Leverage | Position Notional | Loss From 5% BTC Decline | Loss as % of Initial Margin |
|---|---|---|---|
| 1× | $1,000 | $50 | 5% |
| 2× | $2,000 | $100 | 10% |
| 5× | $5,000 | $250 | 25% |
| 10× | $10,000 | $500 | 50% |
| 20× | $20,000 | $1,000 | 100% |
Source: Illustrative linear leverage calculation. Actual liquidation prices depend on maintenance margin, fees, funding, position mode, and venue-specific rules.
The table explains why a price movement that appears manageable to an unleveraged investor can be severe for a futures trader. At 10× leverage, a 5% decline produces an illustrative loss equal to half the initial margin. At 20×, the same movement would mathematically consume the entire initial margin before accounting for the exchange's liquidation mechanism.
In practice, positions may be liquidated before reaching the full theoretical loss shown in the table. This means that stop-loss placement, margin mode, collateral management, and order-book liquidity can become especially important when the market is volatile.
Readers seeking a more detailed explanation can review Crypto Futures Trading: Leverage, Funding and Apple Perps.
Is $70,000 a Real Bitcoin Support Level?
The $70,000 level is psychologically significant because it is a round number that attracts attention from traders and market commentators. However, a widely discussed price does not become reliable support simply because many investors monitor it.
A support area is meaningful when buying demand repeatedly absorbs available selling around that region. Such behavior may be visible through price stabilization, trading volume, order-book activity, and changes in derivatives positioning.
In a market affected by heavy liquidations, an apparent rebound can also be misleading. For example, prices may rise because short-term sellers have exhausted their positions or because traders close profitable short positions. Neither outcome necessarily demonstrates a lasting increase in investment demand.
This is why analysts should consider multiple indicators rather than treating a brief recovery above $70,000 as confirmation that the decline has ended.
Three Bitcoin Market Scenarios
| Scenario | What Would Support It | What It Would Not Prove |
|---|---|---|
| Stabilization near $70K | Reduced selling, steadier ETF flows and improving spot demand | That a durable bottom is confirmed |
| Temporary Relief Rally | Short covering and a rapid rebound after liquidations | That institutional demand has recovered |
| Continued Weakness | Persistent ETF outflows, failed rebounds and renewed liquidations | That BTC has a predetermined lower target |
Source: Analytical scenarios based on observed ETF and derivatives-market behavior; not forecasts or verified trading signals.
The most useful distinction is between a rebound supported by actual buying and one driven primarily by positioning adjustments. If prices recover while leverage increases sharply but ETF outflows persist, the market may remain vulnerable to another liquidation cycle.
Conversely, a stabilization accompanied by improving spot demand and lower excessive leverage would provide a different type of evidence. Even then, Bitcoin remains exposed to wider financial conditions and market uncertainty.
Why Are Technology Stocks and Bitcoin Moving Together?
Bitcoin has often been presented as an alternative monetary asset, but its short-term trading behavior can also resemble that of other volatile investments. During periods of market stress, investors may reduce exposure across several asset classes at the same time.
The November selloff coincided with weakness in major technology stocks and concerns surrounding AI infrastructure investment. Those developments may have contributed to a broader reduction in risk appetite, but their influence cannot be precisely isolated from cryptocurrency-specific factors.
Institutional portfolios can create connections between otherwise unrelated markets. A fund facing losses, redemptions, or changes in risk limits may reduce positions in several holdings, even when the assets have different long-term economic characteristics.
At the same time, Bitcoin's derivatives market has its own dynamics. Funding rates, open interest, concentrated leverage, and liquidity conditions can amplify or offset movements originating elsewhere in financial markets.
The practical conclusion is that market correlation during a selloff does not necessarily imply a permanent economic relationship. Bitcoin's short-term price reaction can reflect global portfolio behavior without changing how the Bitcoin network itself operates.
What Indicators Should Bitcoin Investors Monitor Next?
ETF flows remain one of the clearest measures of whether investment-product demand is stabilizing. If negative flows continue across several sessions, they may indicate that institutional and brokerage-channel investors are still reducing exposure. A return to positive flows would be encouraging but would not independently guarantee a market recovery.
Futures open interest provides another useful perspective. Falling open interest during a price decline can indicate that positions are being closed or liquidated, while increasing open interest can suggest that new leveraged exposure is entering the market. Neither direction is automatically bullish or bearish without examining price, funding, and trading activity together.
Spot-market liquidity is equally important. A market can rebound rapidly when selling pressure temporarily subsides, but sustained recovery requires buyers willing to absorb available supply. Investors should therefore watch volume and execution conditions rather than relying on a single candlestick pattern.
Finally, macroeconomic developments and equity-market sentiment may continue to influence cryptocurrency valuations. Interest-rate expectations, technology-sector earnings, and broader capital-market liquidity can affect whether investors increase or reduce exposure to volatile assets.
How to Buy and Trade Bitcoin (BTC) on WEEX
WEEX provides BTC/USDT spot trading and perpetual futures for eligible users. Spot trading allows users to buy and hold Bitcoin, while perpetual futures provide derivatives exposure to BTC price movements without requiring ownership of the underlying cryptocurrency.
Step 1: Register on WEEX and Fund Your Account
Go to the WEEX official website and create an account or log in. Complete any required account verification, then deposit USDT through an available funding method. If transferring USDT from another wallet or exchange, carefully confirm that the selected blockchain network matches the deposit network supported by WEEX.
Step 2: Navigate to the BTC/USDT Spot Market
Open the BTC/USDT Spot Trading page and review Bitcoin's current market price, trading volume, and order-book liquidity. Select the buying option and choose between a market order, which seeks execution at available market prices, and a limit order, which allows you to specify a preferred purchase price.
Step 3: Buy Bitcoin and Manage Your Holdings
Enter the amount of BTC you wish to purchase or the amount of USDT you want to spend. Review the estimated execution details and trading fees before confirming the order. Once the transaction is completed, your purchased BTC will appear in the relevant WEEX account balance, where you can monitor your holdings or place additional trades.
For users interested in trading both rising and falling Bitcoin prices, WEEX also provides BTC/USDT Perpetual Futures, subject to current availability. Futures trading involves leverage, funding costs, and liquidation risks. These risks are particularly important during periods of sharp price movements and large-scale derivatives liquidations.
FAQ
1. Why is Bitcoin falling in November 2026?
Bitcoin has faced pressure from persistent U.S. spot ETF withdrawals, leveraged long liquidations, and weaker broader market sentiment. These factors can reinforce one another, although no single development fully explains every BTC price movement.
2. Did Bitcoin fall below $70,000 in November 2026?
Bitcoin fell below $72,000 on November 12 and approached the $70,000 region. Some November 13 market reports recorded trades below $70,000. Exact prices depend on the exchange, timestamp, and data provider, so a dated quotation should not be confused with the current market price.
3. How much money left Bitcoin ETFs in early November?
Farside Investors recorded approximately $1.44 billion in combined net outflows from U.S. spot Bitcoin ETFs over the five trading sessions from November 5 through November 11, 2026. These figures represent net investment-product flows rather than an exact measurement of immediate spot-market selling.
4. Does $70,000 guarantee support for Bitcoin?
No. A round-number price can attract attention, but support depends on actual buying demand and market conditions. Bitcoin can move below a widely monitored threshold, and any rebound must be assessed alongside liquidity, ETF flows, and derivatives positioning.
5. Can I trade BTC spot and futures on WEEX?
WEEX provides BTC/USDT spot and perpetual futures trading interfaces for eligible users. Spot trading involves buying or selling supported BTC, while perpetual futures provide derivatives exposure and involve additional leverage, funding, and liquidation risks.
This content is provided for general informational purposes only and doesn't constitute financial, investment, legal, or tax advice. Any events, rewards, online promotions, or related information mentioned herein should not be considered a recommendation, solicitation, or invitation to purchase, sell, trade, or otherwise deal in any crypto assets. Crypto assets are highly volatile and may result in loss. The availability of WEEX services, products, and related events may vary by region. You are responsible for ensuring that your participation is in accordance with applicable local laws and regulations.
You may also like

Are Bitcoin Lightning Wallets Safe? 5 Security Warnings Since August

Anthropic IPO: ANT Date, Price Range and Valuation

Powell Speech Bitcoin: Why Warsh, Not Powell, Moves BTC in 2026
Fed Rate Cut December 2026? Why Markets Now Price a Hike Instead
Fed Rate Decision Bitcoin: How BTC Reacted to Every 2026 Call

BTC Staking in a Crash: What It Protects and What It Does Not
December FOMC Meeting 2026: Dec. 8-9 Rate Hike, 25 or 50 Bps?
CPI Release Date: Next Report Dec. 10, 2026 at 8:30 a.m. ET
November CPI Report: Dec. 10 Release Lands After the Fed Decides
Midterm Election Results Crypto: Who Now Controls Crypto Policy
Midterm Elections Bitcoin Price: What 2014, 2018 and 2022 Show

What Is Project Faro? The $270M Bank Stablecoin Plan Explained

Stablecoin Supply Falls $14.2B in 30 Days: What It Means for Bitcoin
Emerging Copy Trading Exchanges for Futures: 5 Retail Favorites

Copy Trading With No Extra Fees: Which Exchanges Really Qualify?

Beginner-Friendly Crypto Exchanges With Simple Interfaces Ranked
Low-Fee Futures Exchanges That Are Easy to Use: 2026 Cost Test

Is WEEX Safe? Proof of Reserves, 1,000 BTC Fund and Licences Checked (2026)
Bitcoin After Hot CPI: Why December Rate Hike Odds Hit 85%

What Is GRAM? Price Rebounds After Falling Below $1, Telegram Wallet Data and What Is Confirmed
Why Is My WEEX Crypto Withdrawal Still Pending?

PROJECT CORTEX (XTX) Price: Why a 15.8M% Gain and a $6 Billion Market Cap Are Hard to Trust

Copy Trading Platforms With Verified Performance: Spot the Fakes
Top 10 Crypto Derivatives Exchanges Worldwide by Open Interest
Beginner Futures Exchanges With Low Entry: What $50 Really Buys
User-Friendly Crypto Copy Trading Platforms: 6 Picks Compared

WEEX Review: The Latest Fees, Features, Security and Trading Experience
Midterm Elections Crypto Fallout: $170M Spent, Key Races Lost

FreeBitco.in Shutdown: Frozen Withdrawals and What Users Can Do
Why Is Bitcoin Down Today? BTC's Slide to $76K Explained
Are Bitcoin Lightning Wallets Safe? 5 Security Warnings Since August
Anthropic IPO: ANT Date, Price Range and Valuation
Powell Speech Bitcoin: Why Warsh, Not Powell, Moves BTC in 2026
Fed Rate Cut December 2026? Why Markets Now Price a Hike Instead
Fed Rate Decision Bitcoin: How BTC Reacted to Every 2026 Call
BTC Staking in a Crash: What It Protects and What It Does Not